
Marketing KPIs Explained: A Roadmap to Smarter Tracking
September 17, 2025
Introduction
Marketing Key Performance Indicators (KPIs) are the measurable values that show how effectively your marketing efforts achieve business goals. The right KPI dashboard turns raw data into actionable insights.
For example, monitoring metrics like conversion rate and customer lifetime value helps marketers see what’s working and quickly adjust underperforming campaigns.
With KPIs aligned to objectives, teams gain real-time visibility into performance, spotting trends, fixing issues, and staying focused on growth. In short, well-chosen KPIs turn marketing data into a clear roadmap for success.
Choosing the right KPIs transforms data into a clear performance dashboard for marketers. These metrics (like conversion rate, ROI or CLV) guide strategic decisions and highlight what drives campaign growth.
Why Marketing KPIs Matter

Marketing KPIs translate business objectives into measurable outcomes. They keep your team focused on what really matters. As LinkedIn notes, when you use the right KPIs, they “provide a simple, focused way to gauge and course-correct campaign performance”. In contrast, tracking irrelevant metrics can obscure problems and waste budget.
KPIs also promote accountability: assigning clear targets ensures each initiative has a measurable goal and can be evaluated. Moreover, analyzing KPI trends helps forecast future results and adjust strategies in advance.
In practice, this means KPIs drive smarter decisions and higher ROI by constantly aligning marketing activities with overall business goals.
Types of Marketing KPIs

Marketing KPIs span multiple categories, reflecting different objectives. Common types include:
1. Financial KPIs
Metrics focused on revenue impact, such as Return on Investment (ROI), Cost Per Acquisition (CPA), and revenue growth rate. These show whether marketing spend yields profit.
2. Acquisition KPIs

Metrics like Customer Acquisition Cost (CAC), Cost Per Lead (CPL), and conversion rate measure the efficiency of attracting new customers and prospects. For example, conversion rate tracks the percentage of visitors who take a desired action (e.g. signup or purchase).
3. Retention KPIs
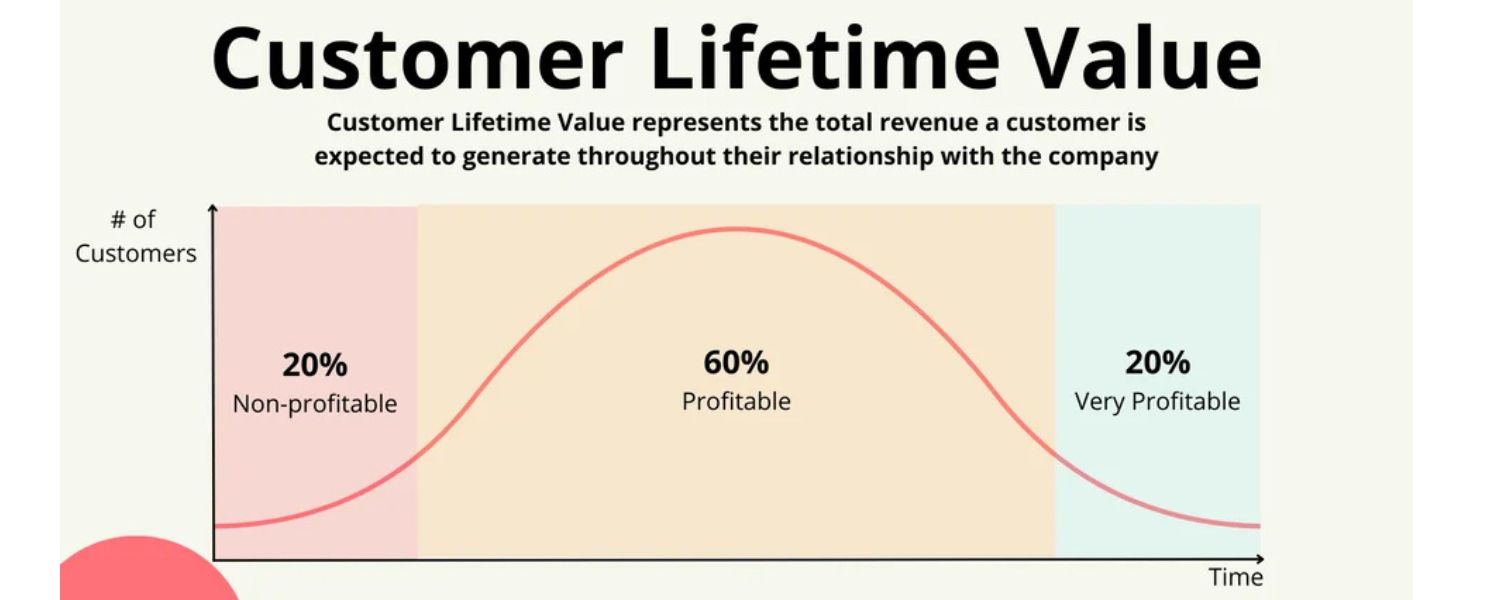
Indicators of customer loyalty, such as Churn Rate, Customer Lifetime Value (CLV) and retention rate. High CLV or retention suggests satisfied customers, while churn rate reveals if customers are leaving. Tracking these over time shows how marketing and service quality affect long-term revenue.
4. Engagement KPIs
Measures of audience interaction, including Click-Through Rate (CTR), social media engagement (likes, shares, comments), and email open rates. These show how well content resonates with the audience. For example, CTR (clicks divided by impressions) indicates how compelling an ad or post is to viewers.
5. Content & Traffic KPIs
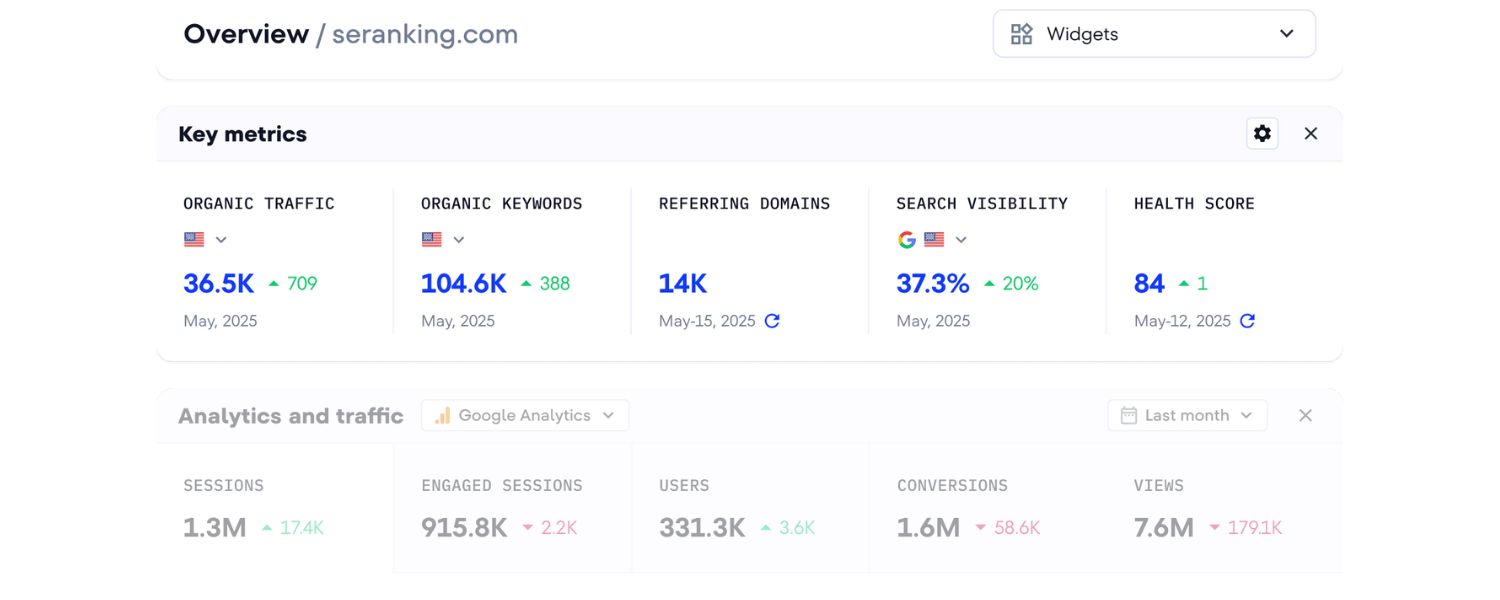
Website metrics like organic sessions, page views, bounce rate, and time on page gauge content effectiveness. High traffic and low bounce rate imply engaging content. Similarly, search rankings and keyword visibility measure SEO success.
6. Social Media KPIs
Metrics specific to social channels, such as follower growth, reach, and share of voice. These help track brand awareness and content virality.
7. Email Marketing KPIs
Metrics like subscriber count, open rates, and click rates show the health of email campaigns. A growing subscriber list and high open rates typically signal strong audience interest.
8. Qualitative KPIs
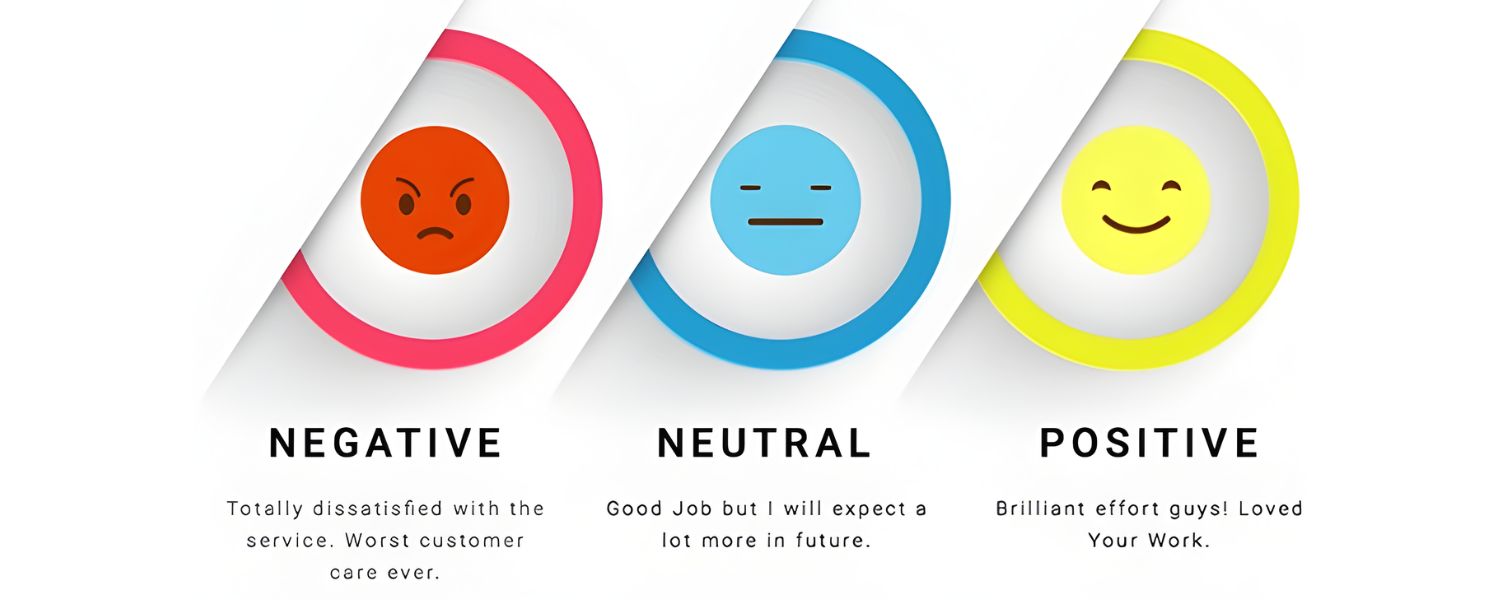
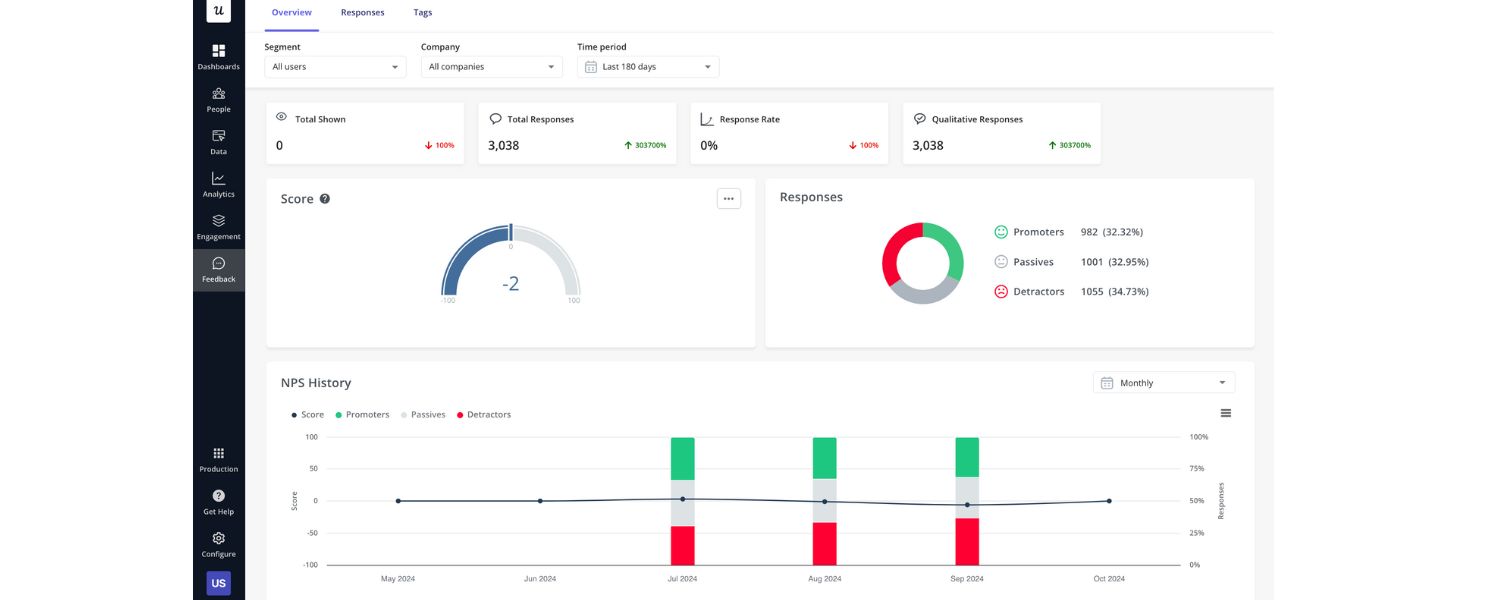
These include sentiment analysis, brand reputation, or customer feedback scores (such as Net Promoter Score), which capture non-numeric factors that matter for overall brand health.
Each KPI type should align with specific goals. For example, if brand awareness is the goal, prioritize traffic and social reach metrics. If driving sales is key, focus on lead/conversion and financial KPIs like ROI.
Key Marketing KPIs to Track
While every business has unique goals, the following essential KPIs cover the most critical areas of performance:
1. Lead Generation & Sales Metrics
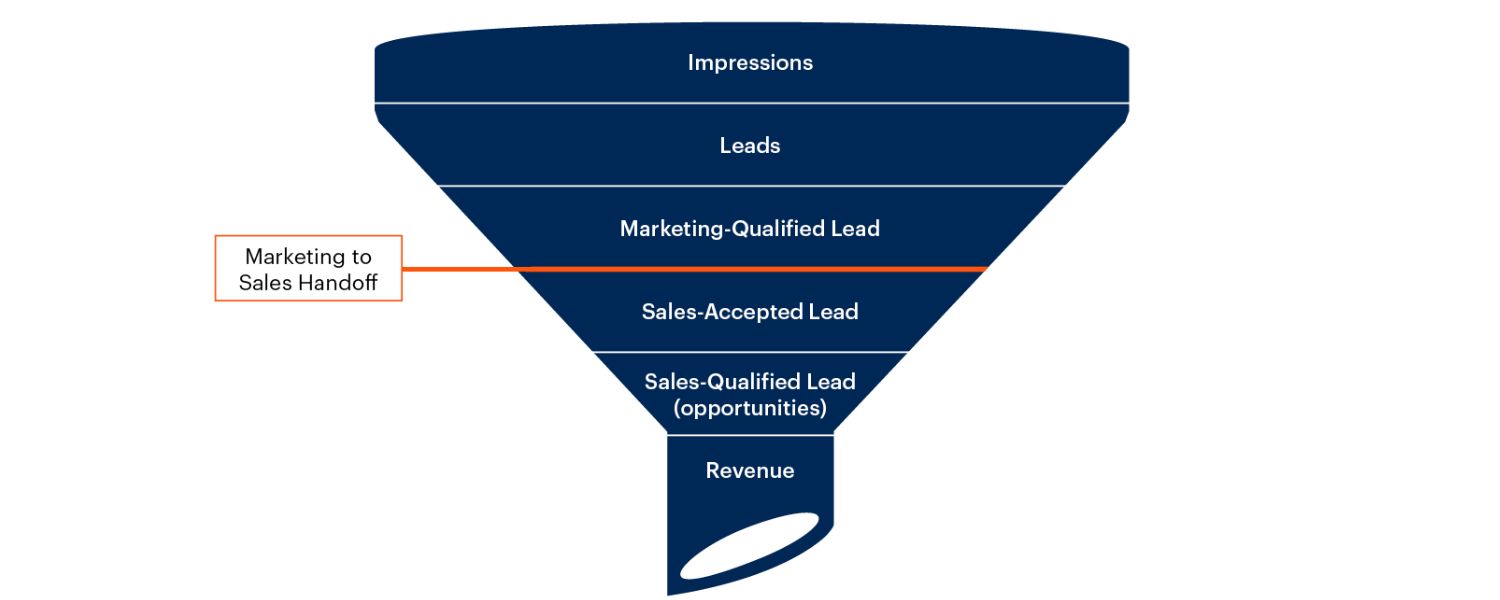
Number of Leads (total and qualified), MQLs/SQLs, and Leads-to-Customer Conversion Rate. These quantify how many prospects marketing delivers and how many eventually convert to customers.
For B2B companies, tracking Marketing Qualified Leads (MQLs) and Sales Qualified Leads (SQLs) bridges marketing efforts to the sales pipeline.
2. Conversion Metrics

Conversion Rate, Click-Through Rate (CTR), and Cost Per Lead (CPL). Conversion rate shows the share of visitors who take a desired action, while CTR measures ad or email engagement.
Together with CPL (marketing spend divided by leads), these KPIs reveal campaign efficiency. A high CPL or low conversion rate signals a need to optimize targeting or messaging.
3. Traffic & Reach

Website Traffic (sessions, unique visitors) and Traffic Sources. Total site visits gauge overall reach, while breakdown by channel (organic, paid, referral) shows which channels drive traffic.
Tracking visitor behavior (e.g., pages per session, bounce rate) helps assess content relevance. High traffic with low conversions could indicate mismatched content or poor UX.
4. Engagement & Content Performance
Social Media Engagement (likes, shares), Email Open/Click Rates, Time on Page. These KPIs measure audience interest. For example, Gardner reports ~40% of B2B buyers use social media in their purchase journey, making social engagement a valuable KPI. Similarly, high email open/click rates indicate that campaign content resonates with recipients.
5. Financial & ROI Metrics
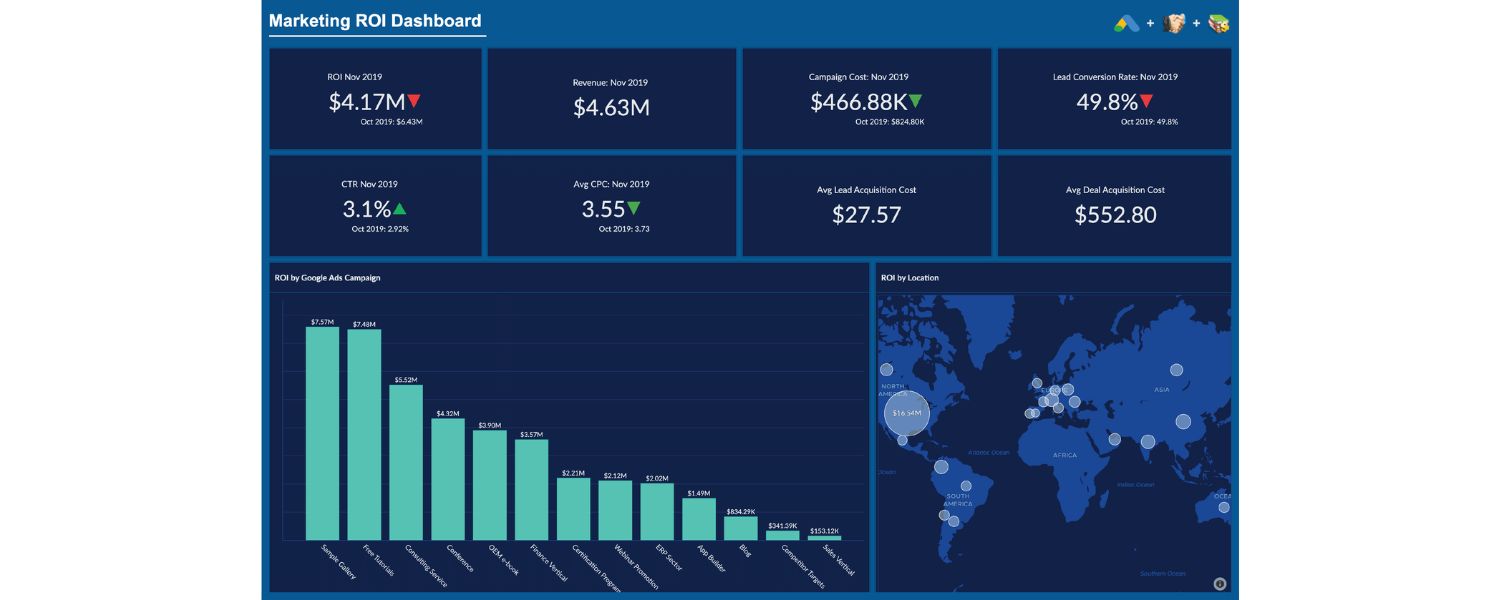
Return on Marketing Investment (ROI or ROMI) and Customer Lifetime Value (CLV). ROI compares profit gained versus marketing cost, justifying budget allocation. CLV estimates total revenue a customer brings over time. Together these metrics show long-term value: a high CLV-to-CAC ratio means customers are worth the acquisition cost. Another related KPI is Return on Ad Spend (ROAS), focusing on ad campaign returns.
6. Retention & Loyalty Metrics
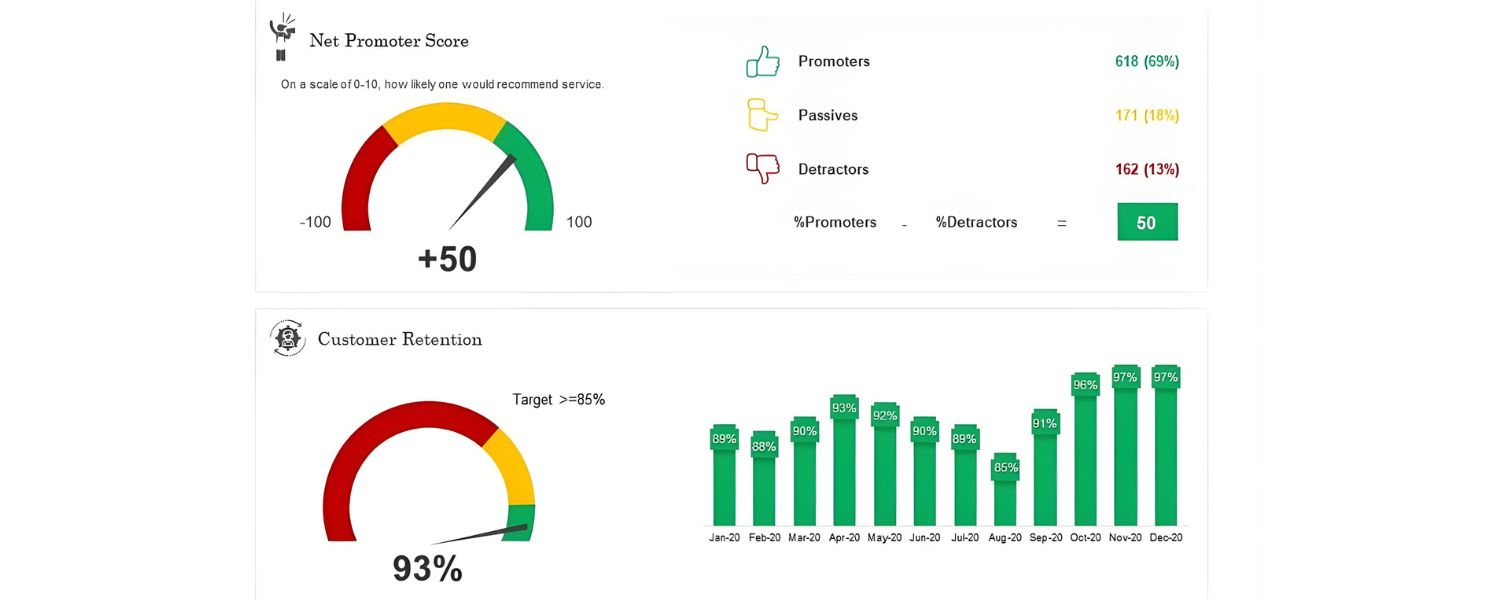
Customer Retention Rate, Churn Rate, and Net Promoter Score (NPS). These indicate how well marketing and service keep customers over time. For instance, Indeed notes that high retention or NPS means customers are likely to keep engaging with your brand. Monitoring retention helps refine customer loyalty programs or post-sale support.
These examples cover a broad spectrum of marketing performance. Which KPIs are “most important” depends on your objectives. For instance, LinkedIn highlights ROI, CLV, CPL, and conversion ratios as top B2B metrics.
In practice, mix several KPIs to form a balanced view. Use leading indicators (like web traffic or demo requests) to predict future results, and lagging indicators (like sales revenue) to assess outcomes over time.
Setting and Measuring KPIs Effectively

To be useful, KPIs must align closely with your goals and be measured consistently. Start by defining clear objectives (e.g. “increase qualified leads by 20%” or “boost online sales by 15%”).
Then choose KPIs that directly reflect those goals. For example, a content marketing goal might focus on website traffic, time on page, and lead gen. In contrast, a lead-generation campaign should emphasize conversion rate and cost metrics.
Each KPI should be measurable and actionable. Improvado advises that tracking KPI trends can help forecast future performance and enable proactive adjustments.
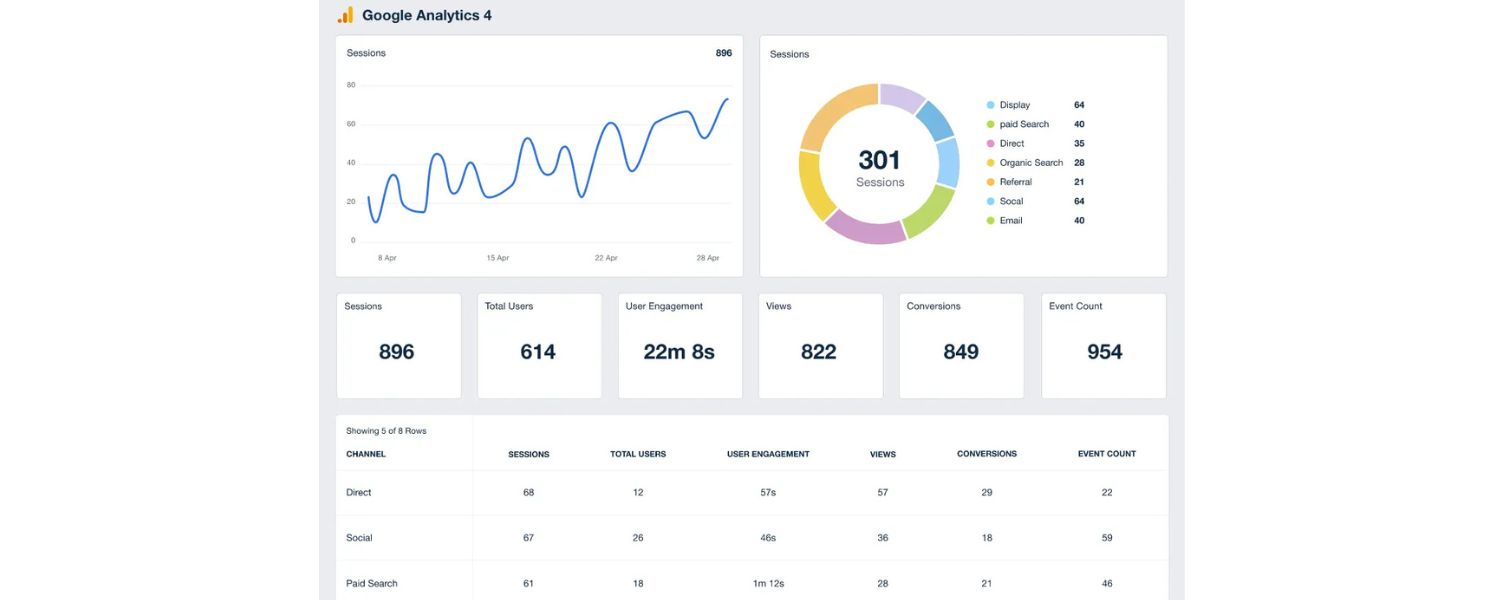
Make sure you have the tools to measure each metric (for instance, Google Analytics for web traffic, CRM software for lead and sales tracking). Establish a baseline and targets for each KPI (e.g., “achieve a 5% conversion rate this quarter”).
Tools & Dashboards: Marketers typically use analytics platforms and dashboards to monitor KPIs in real time. CRM systems (like NetSuite CRM or HubSpot) can centralize key metrics from sales and marketing in one place.
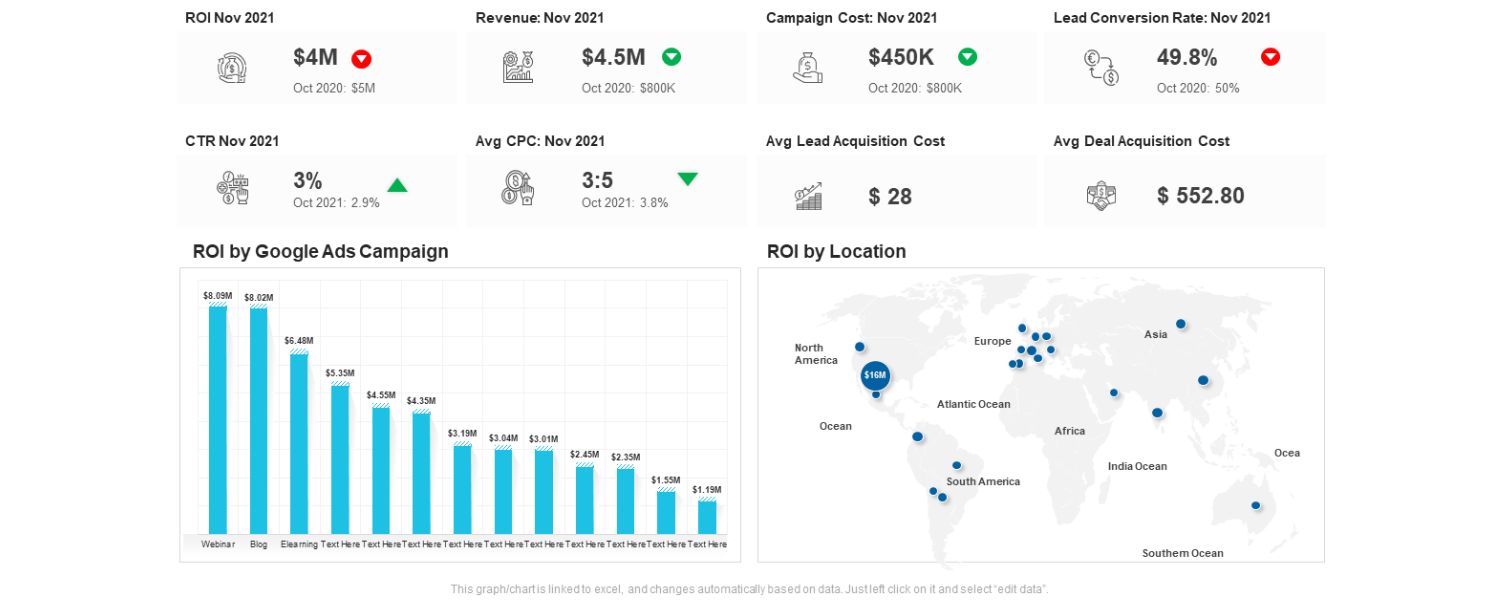
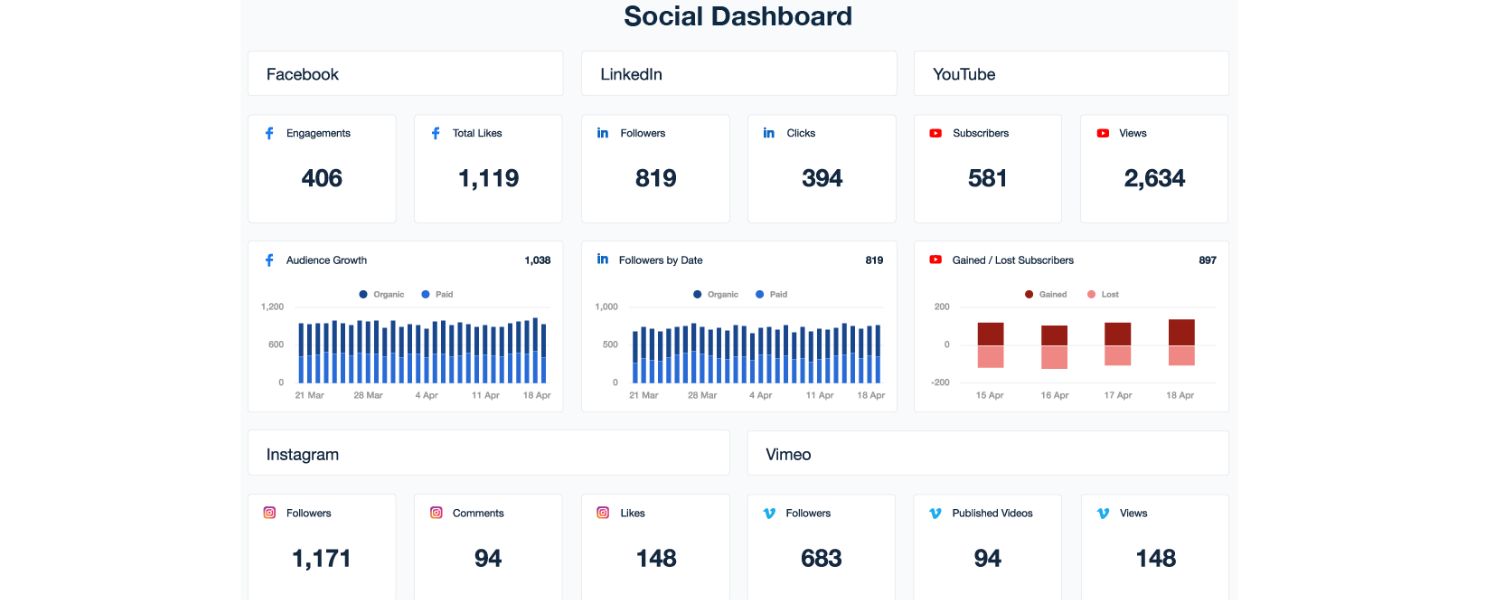
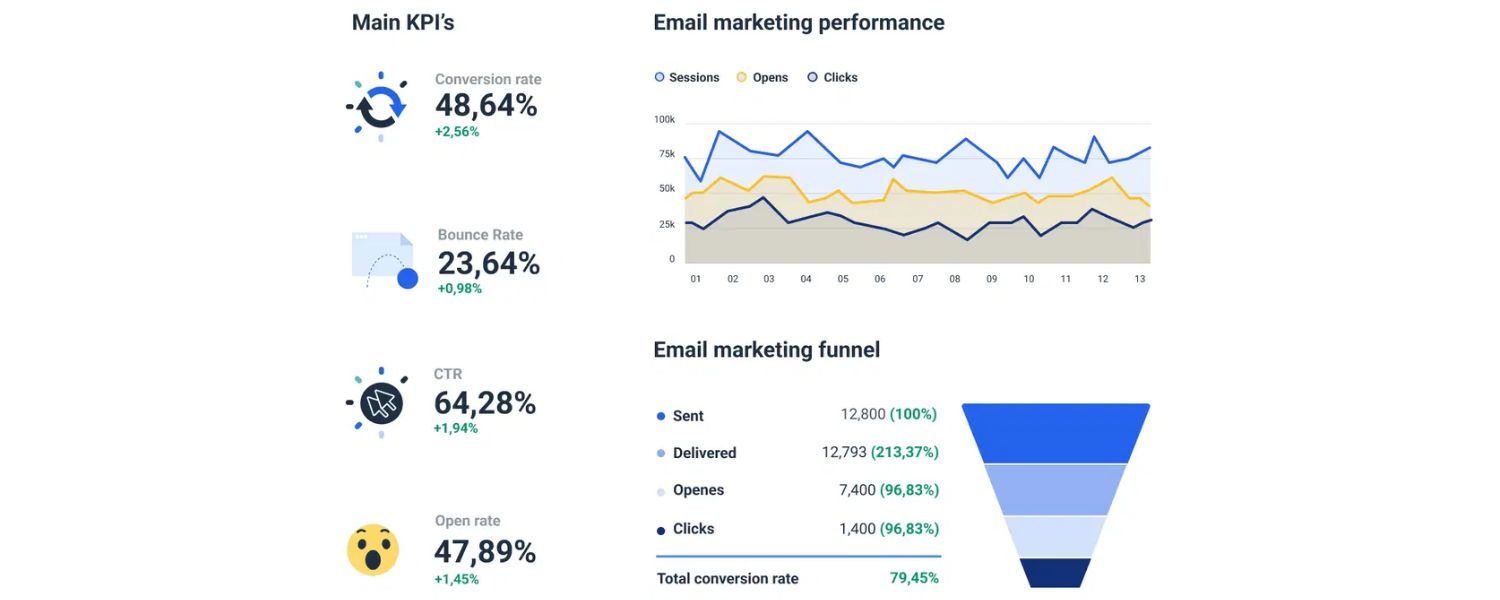
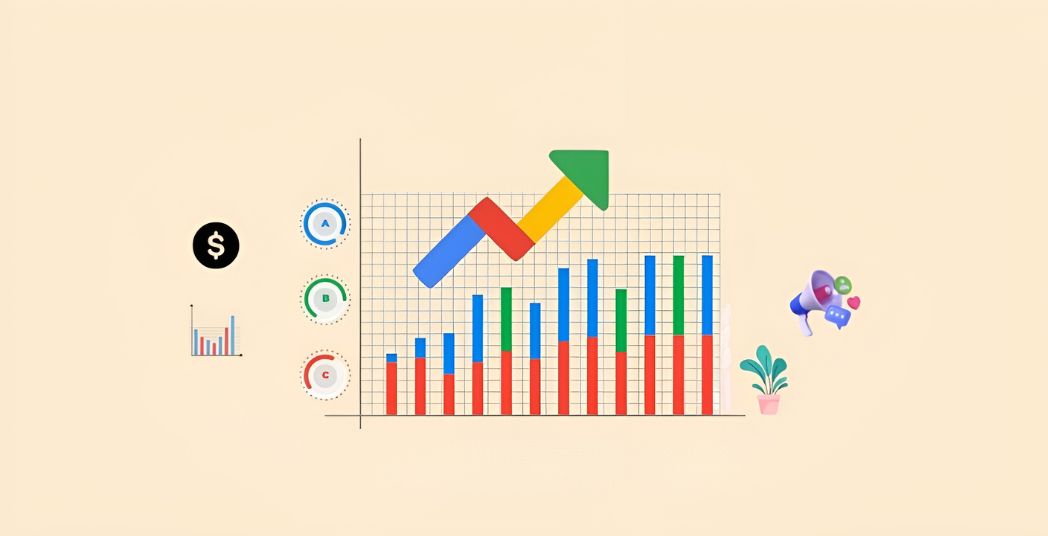
Visualization dashboards present KPIs with charts and tables for quick insights. For example, a marketing KPI dashboard might display leads, conversion rate, CAC, and sales by region in one view, helping teams spot problems immediately.
Many businesses also use integrated analytics tools (e.g. Google Analytics, Data Studio, Tableau) to pull data from multiple channels. The aim is a single-pane view of performance that makes tracking and comparing KPIs easy.
Dashboards that compile marketing KPIs (like leads, conversion rate, CAC, and sales by region) make data quickly understandable. Presenting these metrics as charts and tables helps teams spot trends at a glance and make faster decisions.
Partnering with Experts and Agencies
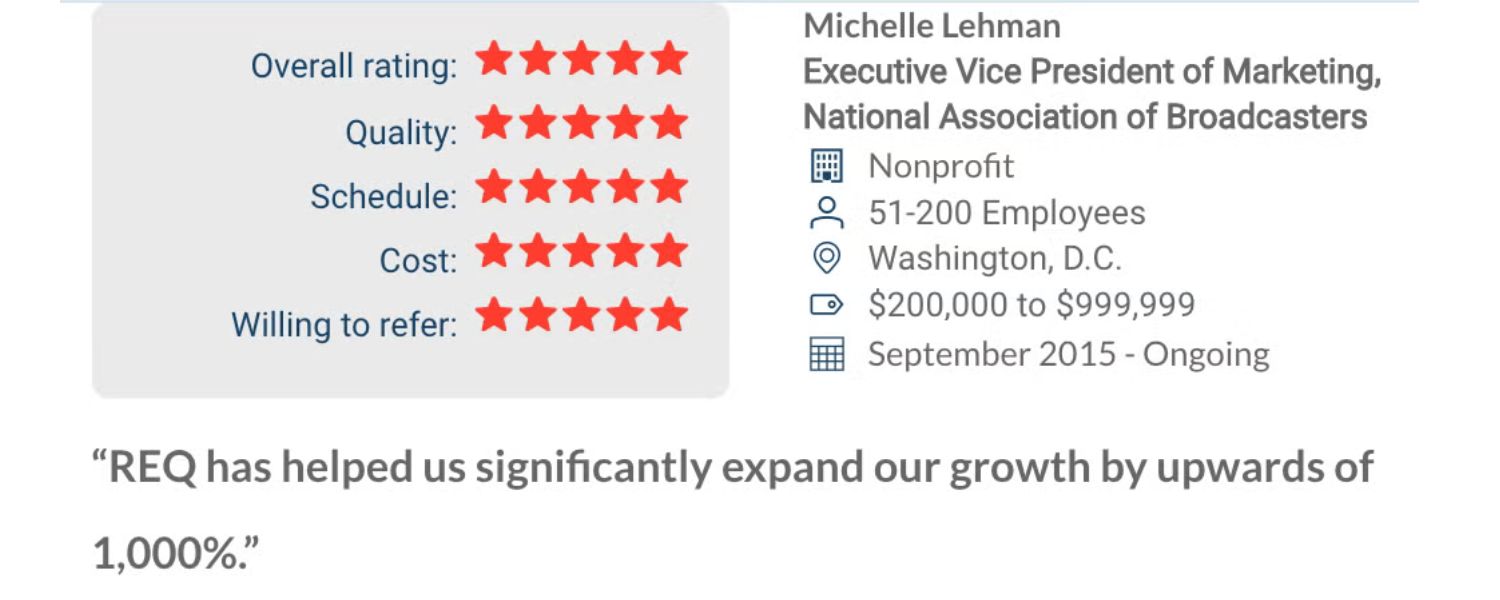
Implementing and optimizing KPIs can be complex. Many businesses partner with experienced marketing agencies to develop and track their KPI strategies. On directories like Clutch and GoodFirms, agencies often highlight their success in data-driven marketing.
Offshore Marketers stands out as a top-rated global digital agency in this space. They “specialize in digital marketing services, including SEO, PPC, social media management, website design, and e-commerce solutions” – covering the full spectrum of channels tied to key metrics.
Clients have given Offshore Marketers **5.0-star ratings on Clutch (39 reviews) and GoodFirms (81 reviews), as well as a 4.8/5 Trustpilot score (45 reviews), praising their data-driven approach, technical expertise, and ROI-driven results. (For example, one review notes their “deep technical knowledge and strategic, growth-oriented mindset” leading to significant traffic and conversion gains.)
Local agencies often focus on regional markets, and many also maintain high client ratings. But Offshore Marketers’ global perspective and personalized strategies have earned top client feedback worldwide.
When choosing an agency, look for one with proven case studies and high ratings on review platforms. Many firms highlight achievements like boosting organic traffic, improving conversions, and increasing revenue – all tied to the KPIs they managed.
Ultimately, working with an experienced partner can accelerate your KPI success by providing strategic guidance, implementation support, and ongoing analytics.
Call to Action: Ready to improve your marketing ROI? Start by defining clear KPIs aligned with your goals. If you need expertise, consider partnering with a dedicated agency. Offshore Marketers – with its perfect client ratings and full-service offerings – is one example of a KPI-focused marketing partner.
Their team can help you identify the right metrics, set targets, and continuously optimize campaigns. Contact an analytics-savvy agency today to turn your marketing data into growth.
FAQs
Q1: What is a marketing KPI?
A marketing KPI (Key Performance Indicator) is a quantifiable metric that gauges progress toward key business goals. In other words, it’s a specific, measurable value – such as conversion rate, cost per lead, or customer lifetime value – that shows how effectively your marketing activities support your strategic objectives.
Q2: Why are marketing KPIs important?
KPIs focus your team on meaningful outcomes. They let you track the real impact of campaigns and “gauge and course-correct” as needed.
By tracking the right KPIs, marketers ensure efforts are aligned with business goals and avoid chasing vanity metrics. Clear KPIs also foster accountability and continuous improvement, since teams can see if changes lead to better results (higher ROI, increased leads, etc.).
Q3: How do I choose the right marketing KPIs?
Begin with your objectives and target channels. Each marketing goal has its own relevant KPIs. For example, a content marketing goal might prioritize website traffic and engagement metrics, whereas a lead-generation goal would emphasize conversion rates and CPL.
Improvado recommends ensuring selected KPIs are measurable and actionable, and tied to available data tools. In practice, list your main marketing goals (brand awareness, lead gen, sales, etc.) and pick a few key metrics for each (e.g., for sales: ROI and lead-to-customer rate).
Q4: What are some essential marketing KPIs to track?
There are many, but commonly used KPIs include ROI/ROMI (return on marketing investment), Conversion Rate, Cost Per Lead (CPL) or CPA, Website Traffic, Customer Lifetime Value (CLV), Email Open/Click Rates, and Social Media Engagement.
Many businesses also track Lead Quality and MQL/SQL conversion to tie marketing to sales. The right mix depends on your business model, but ensure you cover leads, conversions, costs, and revenue aspects. NetSuite notes that ROI, CLV, CPL, and lead-to-conversion ratio are especially important metrics.
Q5: How often should KPIs be updated or reviewed?
KPIs should be reviewed any time your business goals or strategy change. In a fast-moving market, teams often update targets monthly or quarterly.
NetSuite advises that if KPI trends reveal new directions, you might adjust your goals and then update KPIs accordingly. In practice, set a regular review cadence (e.g., monthly dashboards, quarterly strategy check-ins) to ensure KPIs remain relevant and aligned with evolving objectives.
Q6: What tools can I use to track marketing KPIs?
Most marketers use analytics platforms and dashboards. Common tools include Google Analytics (for website metrics), CRM systems (like HubSpot or NetSuite CRM for tracking leads and revenue), and marketing automation platforms (for email and campaign analytics). These tools can visualize KPIs in real time through charts and reports.
For example, NetSuite CRM can display a variety of marketing KPIs in one place. The key is integration: pull data from all channels into a unified dashboard so you can monitor your KPIs at a glance.
Q7: How do I use ROI and CLV in marketing analysis?
ROI (Return on Marketing Investment) compares the profit generated to marketing costs. It shows overall campaign effectiveness over time. CLV (Customer Lifetime Value) estimates the total revenue a customer will bring over their lifetime.
Together, they help answer “Is our spending justified?” and “How valuable are our customers?” For example, if CLV far exceeds CAC, you have a profitable customer base. Tracking ROI and CLV lets you optimize spend: invest more where ROI is high and consider retention strategies to boost CLV.

.png)
Shopify SEO: Guide to Ranking Your Store and Driving Sales
Most Shopify store owners set up their store, list their...

Content Marketing : Definitive Guide to Strategy, Content Types, and Measurable ROI
Content marketing generates 3x more leads than outbound marketing at...
Above the Fold: Guide to Conversions, Rankings and Faster Pages
Above the Fold in 2026: The Complete Guide to Conversions,...

Off-Page SEO Checklist: Guide to Building Real Authority
Most websites spend months creating great content, only to wonder...

What Is Keyword Bidding? The Complete Strategy Guide for Smarter Ad Spend
Most advertisers believe the highest bid wins the auction. It...
What Is Google Trends? The 2026 Marketer’s Complete Guide
If you are not already pulling weekly insights from Google...
If you want a growth partner who will get to know every aspect of your business and treat your budget like their own — we are the right fit.
.png)
.png)
.png)
.png)
.png)
.png)
2026 ALL RIGHTS RESERVED MADE IN INDIA