
SEO Report: A Complete Guide to Insightful Reporting
August 22, 2025
Introduction
Imagine investing months into SEO campaigns without a clear way to show the results. This is where an SEO report becomes your best friend. An SEO report distills complex search data into an easy-to-understand overview of website performance, from traffic and rankings to conversions and site health.
Done right, it demonstrates the value of your SEO efforts and keeps everyone from clients to CEOs in the loop. In fact, with people conducting over 99,000 Google searches every second and 68% of online experiences starting with a search engine, businesses need SEO more than ever, and solid reporting to match.
This guide will show you how to create SEO reports that not only track critical metrics but also tell the story behind the numbers. We’ll cover what an SEO report is, why it’s essential, how often to report, key sections to include, and pro tips for making your reports stand out. Let’s dive in!
What Is an SEO Report?
An SEO report is a document or dashboard that summarizes a website’s performance in search engines. It compiles selected metrics, like organic traffic, keyword rankings, backlink profile, and conversions – to illustrate how well your SEO strategy is working. In essence, it answers: How much traffic are we getting from search? Which keywords and pages are driving that traffic? Are those visitors converting? A good SEO report highlights successes, flags issues, and provides actionable insights for improvement.
SEO reports can take various forms. Some common formats include PDF summaries, slide decks, spreadsheets, or live dashboards. For example, an agency might provide a monthly PDF report with charts and an executive summary, while an in-house team might use a live Google Looker Studio dashboard for real-time monitoring.
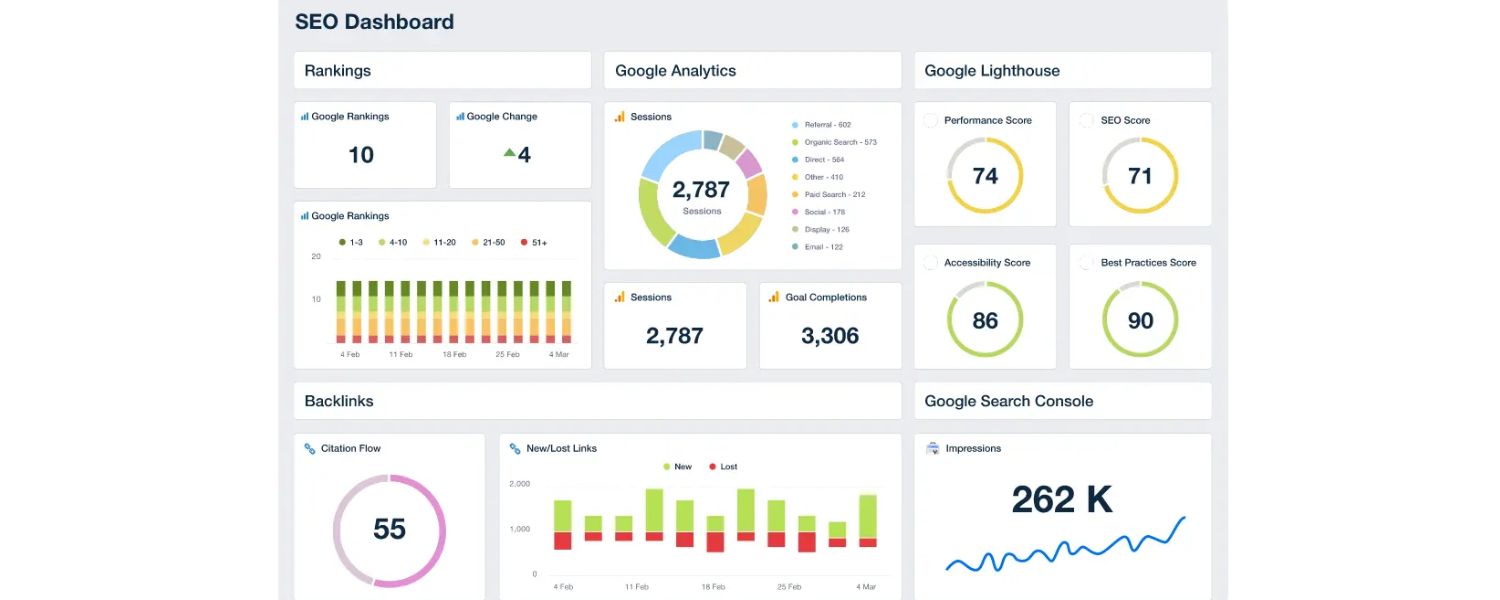
Regardless of format, most SEO reports contain a few key sections (which we’ll detail below): an executive summary of findings, a traffic overview, keyword rankings status, conversion outcomes, backlink analysis, technical site health metrics, and recommendations for next steps. Together, these elements provide a 360° view of SEO performance.
Why SEO Reporting Is Important
SEO is a long-term endeavor, and results don’t happen overnight. Regular SEO reporting is critical for several reasons:
1. Prove ROI and Value
An SEO report translates your optimization work into tangible results. It shows stakeholders how SEO efforts are impacting business outcomes, for example, demonstrating growth in organic traffic and conversions (leads, sales, etc.) over time. By including metrics like conversion rates optimization and revenue from organic search, you directly tie SEO to ROI, which is essential for justifying the SEO budget. In fact, SEO can deliver an average ROI of ~5.3×, higher than many other channels, so it’s crucial to communicate that payoff.
2. Track Progress and Spot Issues
With regular reports, you can quickly identify trends, both positive and negative. Spikes or dips in traffic and rankings become obvious, allowing you to react swiftly to algorithm updates or technical problems. For example, if an SEO report shows a sudden drop in mobile traffic, you might uncover an issue with your site’s mobile usability or a Google update and fix it before it worsens. Reports also highlight which SEO tactics are working best (e.g. which content or keywords are bringing in the most visitors) so you can double down on what’s effective.
3. Educate and Align Stakeholders
SEO can be complex and confusing for non-SEOs. A well-crafted report demystifies the complexities of SEO for clients or executives. By presenting data in a clear, concise way (with visuals and plain-English explanations), you keep everyone informed about what’s being done and why it matters. This builds trust and credibility.
Clients can literally see the value you’re providing, and internal teams can align their efforts with the findings. As one marketing expert puts it, SEO reports offer crucial insights into website performance, ensuring efforts are measured and aligned with goals.
4. Support Strategic Decisions
Regular reporting enables data-driven decisions. For instance, your SEO report might reveal that one blog topic generates 3× more conversions than others, telling your content team to focus more on that subject. Or it could show that your competitor’s website is outperforming yours in a certain keyword area, prompting a competitive content or link-building strategy. Some reports even include competitor performance tracking or industry benchmarks to give context to your metrics. Overall, these insights help you refine your SEO strategy continuously.
5. Secure Budgets and Buy-In
When clients or executives see steady improvement, e.g. organic traffic up 45% this quarter, or SEO-driven sales hitting a new high, it becomes much easier to justify increasing the SEO budget or continuing the campaign. SEO reports essentially make the case for SEO by spotlighting wins. They also help manage expectations by showing the “slow and steady” growth trajectory typical of SEO, which can prevent impatience or misunderstanding. By highlighting both wins and upcoming opportunities, you position SEO as a long-term investment worth sustaining.
In short, an SEO report is both a measuring tool and a marketing tool. It measures your performance and markets your success to those who need to know. This keeps everyone motivated and on the same page as you work towards higher rankings and traffic.
How Often Should You Create SEO Reports?
Finding the right reporting frequency is important. You want to update stakeholders regularly, but not overwhelm them with data. The industry consensus is to provide SEO reports on a monthly basis for most situations. Monthly reports strike a good balance – they’re frequent enough to catch meaningful changes and keep clients engaged, yet they allow enough time to observe trends (SEO fluctuations week-to-week can be noisy). It’s no surprise that about 58% of marketing agencies send SEO reports to clients every month, making this the most common cadence.
Most agencies send SEO performance reports on a monthly basis, far more than those reporting weekly or quarterly. Monthly reports help highlight meaningful trends while keeping clients in the loop.
That said, other cadences can work depending on needs:
1. Weekly or Bi-Weekly
In very fast-moving campaigns or during critical periods (e.g. a big site migration or seasonal campaign), you might do brief weekly check-ins. ~15% of agencies send weekly updates, often focusing on key metrics or tasks completed each week. These are typically less detailed than monthly reports, perhaps a short email or mini dashboard just to assure progress.
2. Quarterly
For high-level stakeholders or long-term projects, a quarterly SEO report can show the big-picture trajectory. Roughly 8–10% of agencies use quarterly reporting. Quarterly reports are great for summarizing broader trends (like “Organic traffic grew 25% QoQ”) and aligning SEO with quarterly business results.
3. Ad-Hoc or Real-Time
Sometimes you’ll create one-off reports for specific purposes, e.g. an initial SEO audit report for a new client, or a deep-dive report after a major Google algorithm update. Additionally, live dashboards (in tools like Google Analytics or Looker Studio) can provide real-time data anytime, which is useful for internal monitoring between formal reports.
4. Annual Summary
In addition to regular monthly reports, consider an annual SEO report that rolls up the year’s performance. This is an excellent way to show year-over-year improvement and the cumulative impact of your work. For example, an annual report might compare organic traffic and goal completions this year vs. last year, highlight major wins (like “Ranking #1 for 10 more keywords than a year ago”), and set the stage (and budget requests) for the next year’s SEO plan. Many agencies send these yearly summaries a few weeks before clients plan their budgets, to reinforce the value delivered.
In general, monthly SEO reports are recommended for ongoing tracking, supplemented by real-time monitoring and yearly reviews. However, always tailor the frequency to your audience’s preferences. Ask your client or team how often they want updates.
For instance, a data-savvy client might appreciate a shared live dashboard for on-demand stats plus a monthly summary, whereas a busy executive might prefer a high-level quarterly briefing. The key is consistency: if you commit to monthly reports, deliver them on time each month so stakeholders know when to expect their SEO updates. Consistent reporting builds trust and keeps SEO efforts top-of-mind.
8 Key Sections Every SEO Report Should Include
Now let’s get to the heart of the matter, what goes into a great SEO report? The best reports are both comprehensive and concise. They cover all critical aspects of SEO performance, but they do so in a clear, digestible way without overloading the reader. Based on industry best practices, here are eight essential sections (or data categories) to include in your SEO report:
1. Executive Summary
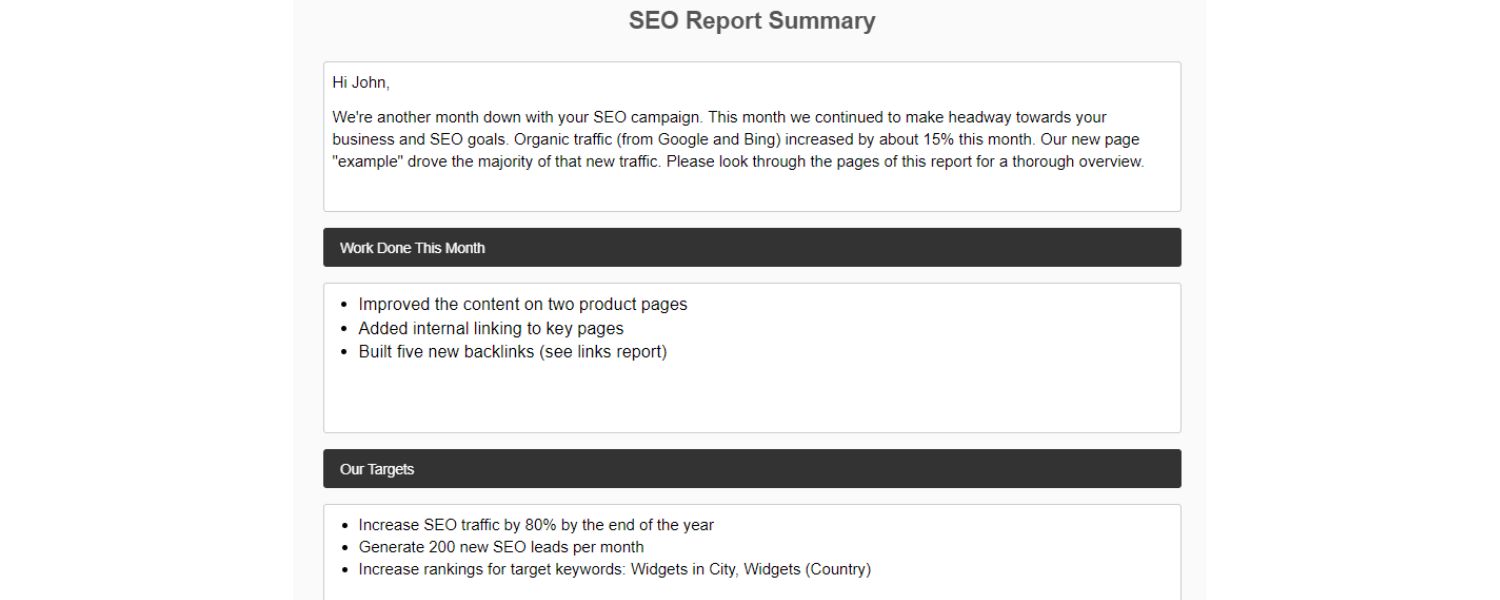
Start your report with a brief executive summary that highlights top-level results and insights. Assume this is all a busy executive might read, so make it count! In 1–2 paragraphs (or a single well-designed slide), recap the overall SEO performance for the period and any standout achievements. Answer the most pressing questions upfront: Did we make progress toward our SEO goals? What changed since the last report? What are the next steps?
For example, your summary might say: “Organic traffic increased by 20% this quarter, resulting in 50% more leads than the previous quarter. We achieved Top 3 rankings for 5 new high-value keywords. However, overall conversion rate from organic traffic dipped from 3.5% to 3.1%, partly due to a site speed issue identified. Next month, we’ll focus on improving page load times and optimizing underperforming pages to boost conversions.” Notice how this addresses results, reasons, and upcoming actions in plain language.
In the executive summary, tie results back to goals. If the client’s goal was to increase e-commerce sales, emphasize how SEO-driven sales grew. If the focus was on content visibility, highlight improvements in rankings or impressions. Keep the tone upbeat but realistic, noting successes and challenges, with a solution-oriented outlook for the future. A strong summary sets the tone for the report and reassures readers that you’re on top of the campaign.
2. Traffic Overview (By Channel)
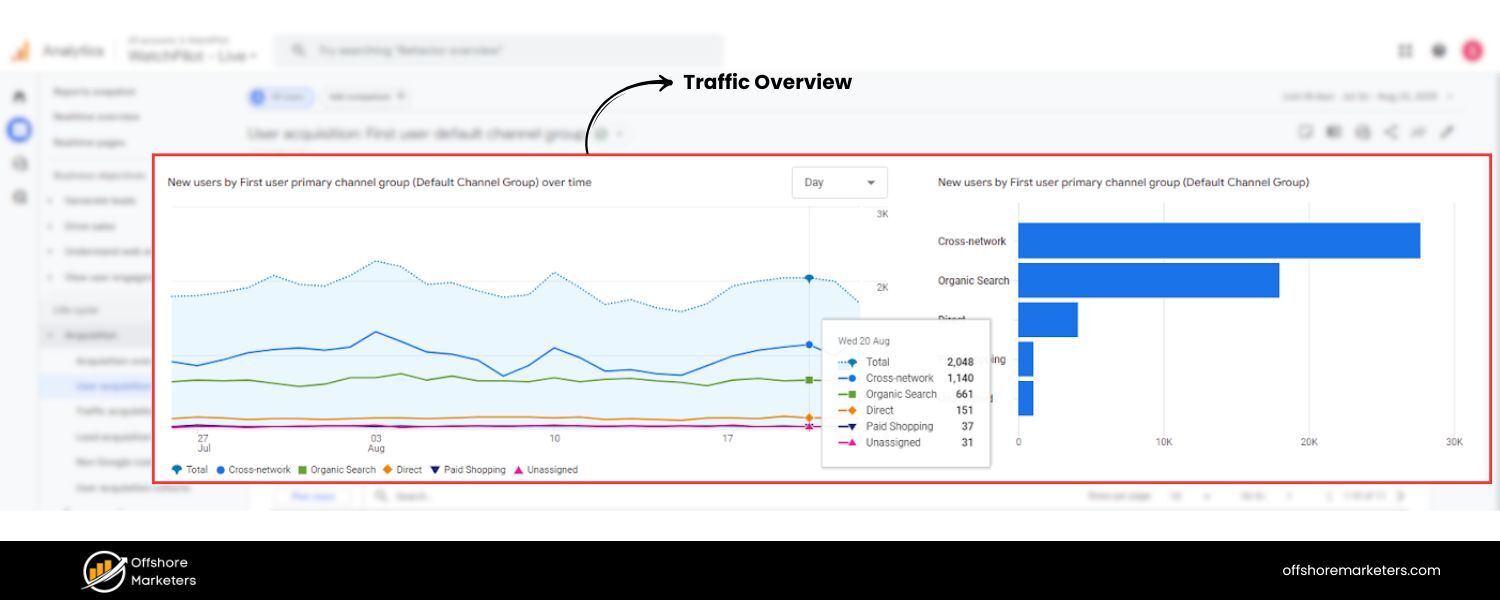
The next section should dive into website traffic, with a focus on organic search traffic (since that’s what SEO influences). Begin by showing the overall traffic trend for the reporting period – how many visitors came to the site, and how does that compare to last period? Then break down traffic by channel/source to underscore the impact of SEO.
For instance, a chart or table can compare Organic Search vs. Paid Search vs. Direct vs. Referral traffic for the month. This context is valuable: if overall visits are up 15% and you show that organic search grew 30% (while other channels stayed flat), the client immediately sees SEO’s contribution.
Excerpt from an SEO report showing a traffic summary. Here, the report highlights total visits and breaks out traffic by source, emphasizing growth in Organic Search traffic (green segment) compared to other channels.
In the organic traffic overview, include metrics on both quantity and quality of visits. Key metrics might include:
A. Total organic visits (or users) during the period, and the percentage change compared to last period.
B. Share of total traffic that organic search represents (e.g. “Organic traffic made up Fifty percent of all website visits”).
C. Geographic or demographic breakdown of organic users if relevant (are you attracting the target audience?).
D. Engagement metrics for organic visitors – e.g. average time on site, pages per session, bounce rate – to gauge quality of traffic.
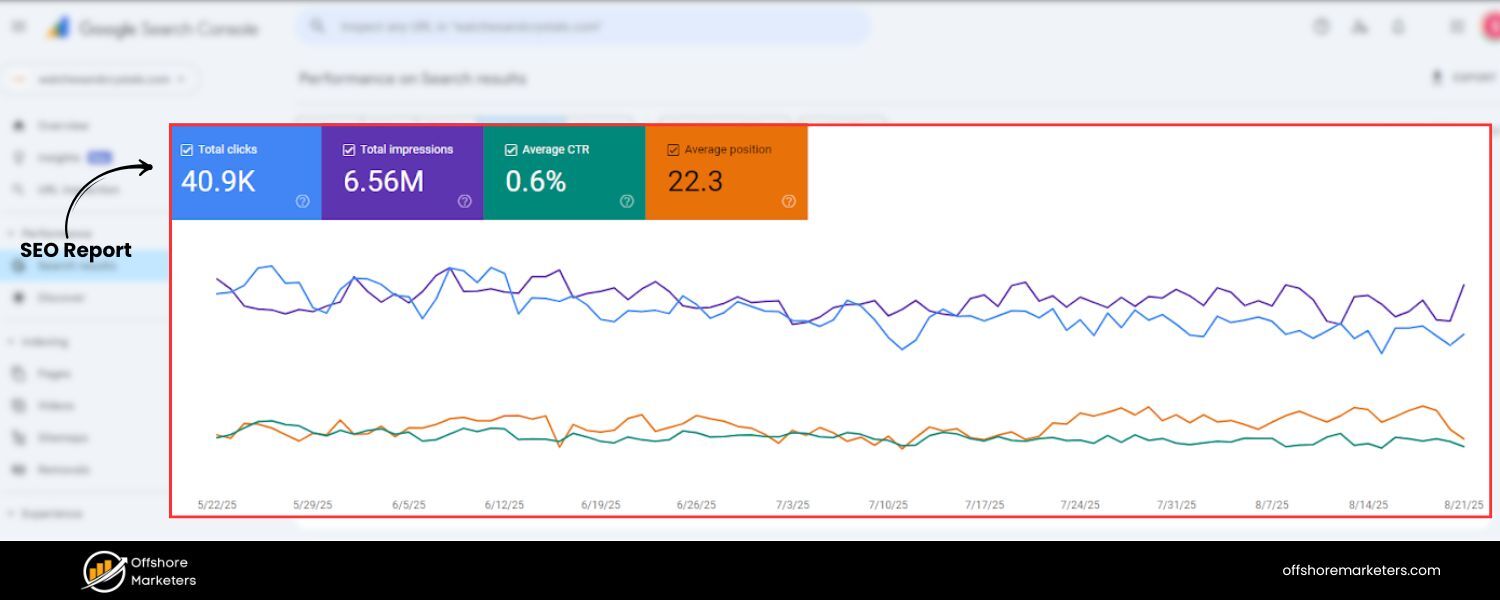
Also consider showing traffic trend charts: e.g. a week-by-week line graph of organic sessions over the month to identify peaks and valleys. If you have seasonality or specific campaigns, annotations on the graph can help (e.g. noting “Google algorithm update on Aug 25” or “Black Friday promo” where relevant).
Importantly, compare traffic to a suitable benchmark. Month-over-month comparisons are standard, but year-over-year comparison is often more meaningful to account for seasonal changes (as SEO pros often note, it’s wise to compare e.g. September 2025 vs September 2024 for a true apples-to-apples view). If you’ve only been working for a short time, you can compare to a baseline from before the SEO campaign started.
This section answers “How much traffic are we getting from search, and is it growing?”. Since increasing organic traffic is usually a primary goal of SEO, placing this near the top of the report “satisfies clients right away” by addressing their top concern. Use visuals from analytics (Google Analytics 4 is perfect for this) to make the data easy to scan – for example, a bar chart of traffic by channel, or a line graph of monthly organic users.
3. Conversions & Goal Completions (Organic ROI)
Traffic is valuable, but conversions are where the money is. The next crucial section of your SEO report should connect organic traffic to business results. In this section, report on conversions coming from organic search – in other words, how many of those organic visitors took a desired action (made a purchase, filled a lead form, subscribed, etc.). This is how you demonstrate the ROI of SEO efforts in concrete terms.
Start by defining what counts as a conversion for this project. It could be e-commerce sales, lead form submissions, phone calls, newsletter signups, or any key action that aligns with the site’s goals. Ideally, these goals are set up in Google Analytics or another tracking tool so you can attribute them to organic traffic.
Report the number of conversions from organic search during the period, and compare it to previous periods. For example: “Organic search brought 120 conversions (sales + sign-ups) this month, a 25% increase from 96 last month.” If possible, also report the conversion rate (the percentage of organic visitors who converted. For instance, “conversion rate from organic traffic was 3.2%, up from 2.8% last month.” Conversion rate trends tell you about traffic quality – rising organic traffic with steady or rising conversion rates is a great sign that you’re bringing relevant visitors.
If you have e-commerce data, include revenue from organic traffic as well. Many clients will zero in on revenue: e.g. “$50,000 in sales came via organic search this quarter, representing 30% of total online revenue.” When clients see that a chunk of their revenue is directly tied to SEO, it powerfully reinforces why SEO matters. In lead-gen contexts, you might instead show how many leads organic produced and even potential value (like “50 demo requests from organic – estimated $500k pipeline value”).
Also provide context for the conversion metrics:
A. Which pages or content drove the most conversions? Maybe your report can list the top converting landing pages from organic users, or top-converting blog articles. This connects SEO efforts (like content creation) to results.
B. Conversion by channel comparison: You can briefly show how organic conversions stack against other channels (e.g. Organic vs Paid vs Email). If organic is outperforming, that’s a win to mention. If it’s behind, it might spark discussion on multi-channel strategy.
C. Trend over time: A graph showing the growth of organic conversions over the past months or year can be compelling to illustrate momentum.
By focusing on conversions, you essentially speak the client’s language – dollars and leads. As one agency tip suggests, track custom goals and report results against those goals; clients will “love this intuitive visualization” of how SEO contributes to their business funne.
The takeaway for the reader should be: SEO isn’t just bringing traffic, it’s bringing valuable traffic that’s taking action. If there are any issues (say conversions dropped or fell short of goal), use this section to acknowledge them and outline plans to improve (perhaps referencing CRO efforts, content tweaks, or targeting different keywords).
4. Top Pages and Content Performance
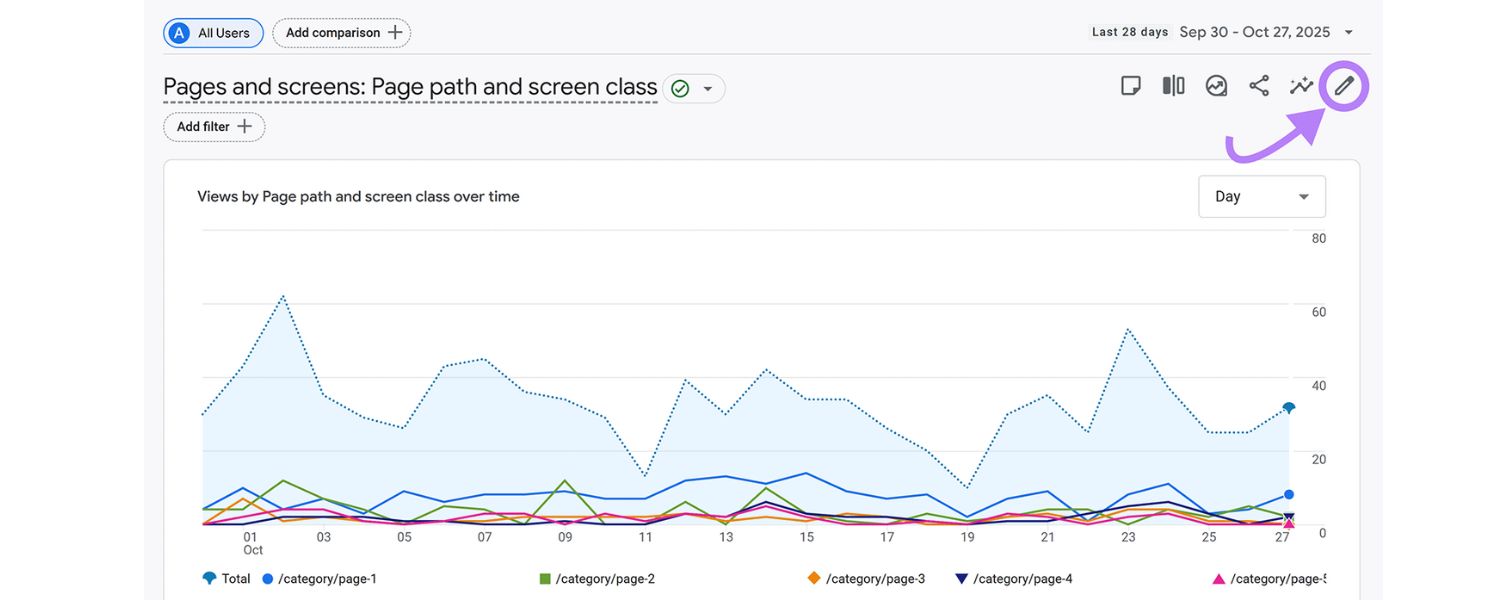
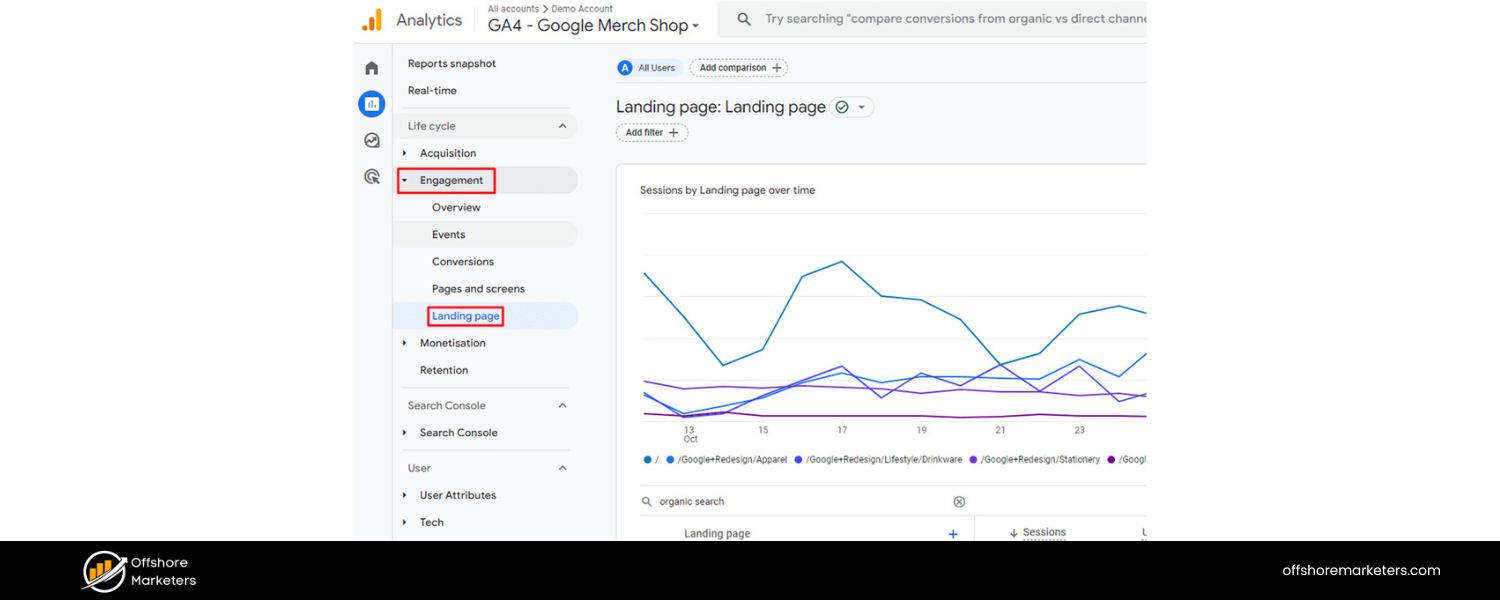
Understanding which pages are attracting organic traffic, and how they perform, is another core element of SEO reporting. In this section, highlight the top-performing landing pages from organic search and what that means for the business. This is essentially a landing page report for SEO visits.
List out (or chart) the top X pages that users entered from search during the period. Commonly, a table of the “Top 10 organic landing pages” with columns for Page URL, Organic Visits, Conversions, Bounce Rate, etc., works well. For each of these high-traffic pages, the client learns what content is bringing people in. For instance, you might show that the blog post “Ultimate Guide to Investing” brought 5,000 organic visits last month, making it the top entry page, with a conversion rate of 2%. Or that the “Pricing” page received 3,000 visits from Google, indicating strong navigational query presence.
After listing the top pages, provide analysis:
A. Are these the pages we expected to perform? If your SEO strategy was targeting certain topics, are those corresponding pages among the top organic drivers? If yes, highlight that success. If not, it may indicate new opportunities or that some optimized pages need more promotion.
B. What is the user behavior on these pages? High bounce rate on a top landing page might signal content that isn’t meeting user expectations, suggesting it needs improvement. On the other hand, a long average time-on-page could indicate engaging content.
C. How do these pages contribute to goals? For example, your homepage might be the most visited, but perhaps the blog brings in more newsletter sign-ups. Point out if a particular content piece not only draws traffic but also leads to conversions (e.g. “Our SEO Checklist blog article is the #2 organic landing page with 4,000 visits, and it generated 100 sign-ups – a strong performer we can replicate.”).
By examining landing pages, you essentially map out the customer journey for organic users. You’ll identify which content resonates most with your audience. Often, this section can reveal pleasant surprises or content gaps. For instance, you might find an older blog post is unexpectedly popular on search, which could be a sign to update that content or create more like it. Or you might see a certain product page isn’t getting much organic love, prompting a focus on optimizing it.
Consider also reporting on new content vs. old content performance if relevant. Clients love to see when a newly published piece starts ranking and bringing traffic (it validates content investments). For example: “The new guide we published in September is already the 8th highest organic landing page with 800 visits, showing quick SEO gains.”
In summary, this section connects the dots between your content strategy and SEO outcomes. It answers the question, “Which pages are pulling in visitors from search, and are those pages doing their job?” – be that engaging the reader or driving a next action. As one expert insight notes, analyzing page-level performance is crucial for understanding user engagement and the effectiveness of your targeted keywords on each page.
5. Keyword Rankings and Search Visibility
No SEO report is complete without addressing keyword rankings. After all, improving rankings for target keywords is a primary goal of SEO. In this section, provide a snapshot of how the site is ranking in search results for important keywords, and how that’s changing over time.
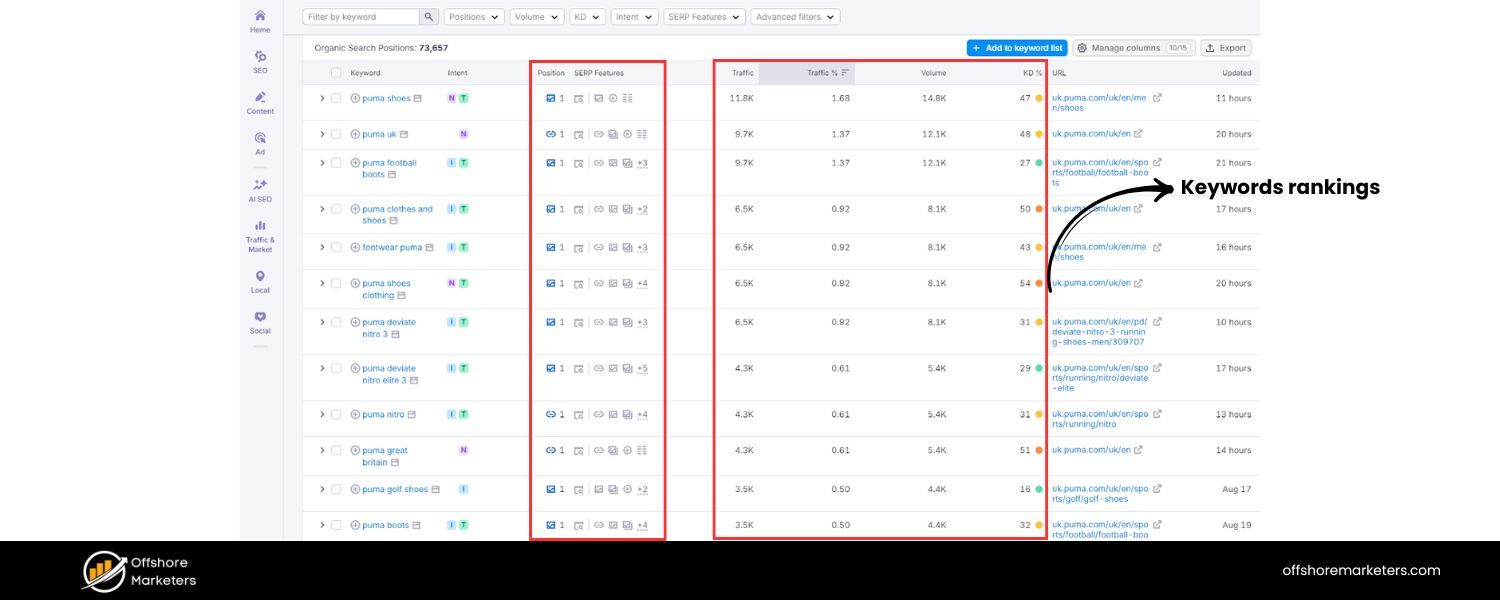
However, a word of caution: avoid overwhelming the client with a dump of every keyword ranking. Focus on the most meaningful data. A smart approach is to highlight a subset of keywords that matter most (e.g. the client’s primary keywords, high-intent terms, or keywords tied to big content pieces) and show their current positions and any movement.
For instance, you might create a table with columns for Keyword – Current Google Rank – Last Month’s Rank – Search Volume. List maybe 10–15 key terms. This immediately shows which terms saw improvement (e.g. “keyword X moved from #5 to #3, now on Page 1”) and which might need attention (“keyword Y dropped from #2 to #5”).
Another way to present rankings is by grouping or summarizing:
A. Overall visibility
Some tools provide a “visibility index” or the percentage of target keywords in the top 10. You can report something like, “Out of 100 tracked keywords, 40 are now on page 1 of Google (up from Thirty last quarter).”
B. New high rankings
Call out any new #1 rankings or top 3 entries achieved, as those are wins the client will cheer for. “We hit the #1 spot for ‘{Keyword}’ this month, which is a major milestone.”
C. Tough spots
Also note if any critical keywords slipped in rank, with brief reasoning or reassurance. “We saw ‘{Important Keyword}’ drop from #3 to #6, possibly due to a competitor’s new content. We plan to counter this by refreshing our page and building a few new backlinks to regain our position.”
Using visuals can help here. For example, a bar chart might show the number of keywords in each position band (e.g. #1-3, #4-10, #11-20, etc.) now versus last report – illustrating overall search visibility gains. Some SEO tools also generate rank tracking graphs for specific terms over time, which can be compelling if a particular keyword has steadily climbed due to your efforts.
Keep in mind, it’s easy for clients to get fixated on individual keyword positions (“Why are we #5 and not #1 yet for X?”). That’s why context is key. Remind them that ranking is not the ultimate goal – traffic and conversions are. Emphasize the positive outcomes of ranking improvements: for example, “Our rise from #9 to #4 for ‘best CRM software’ has led to a 40% increase in organic clicks for that term.” This aligns rankings with business impact.
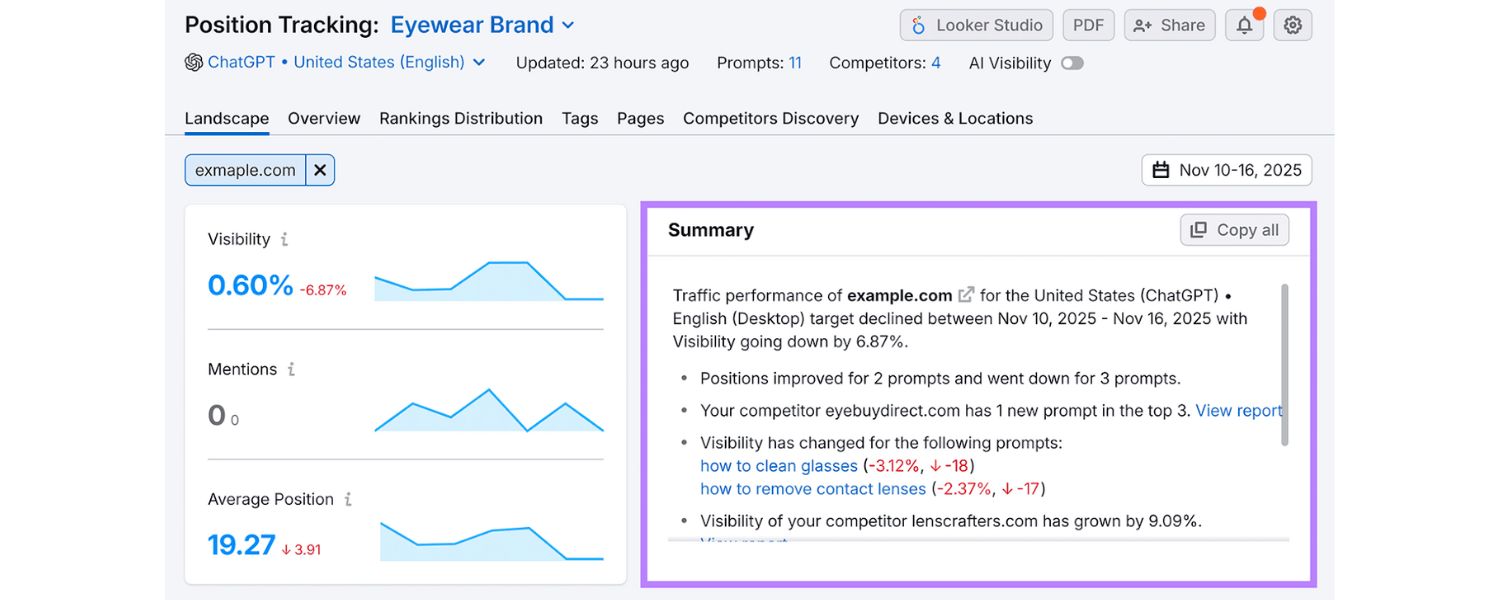
Also, if available, include data on search impressions and click-through rates (CTR) from Google Search Console for top queries. This can enrich the ranking discussion. For example, “We got 50,000 impressions for ‘online course platform’ in Google (avg position ~4) and a CTR of 5%, which is above the industry benchmark of ~3%. This suggests our title/meta are compelling searchers to click, and as we break into the top 3, we can expect even more traffic.”
In summary, the keyword rankings section should show where the site stands on the search results page and how that’s trending, but always circle back to what it means for visibility. A concise snapshot of “our SEO standings” with commentary is far more useful than pages of rank data. As one agency recommends, don’t go too granular; a snapshot of top keywords and their rankings is enough to show you’re “reeling in the right audience.” This keeps the client informed without drowning in data.
6. Backlink Profile Overview
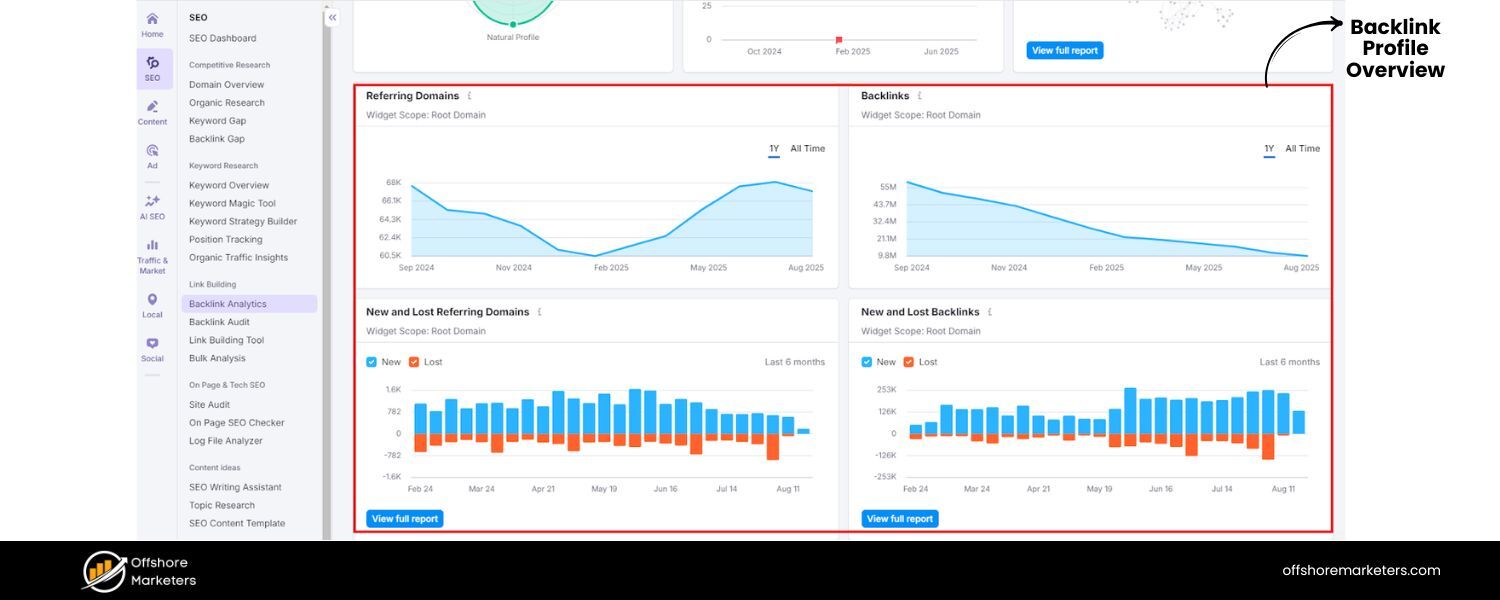

Backlinks (links from other websites to yours) remain a crucial part of SEO authority. Including a section on backlink profile in your SEO report demonstrates that you’re monitoring and improving the site’s off-page SEO. It also reassures the client that their site’s reputation and authority are growing relative to competitors.
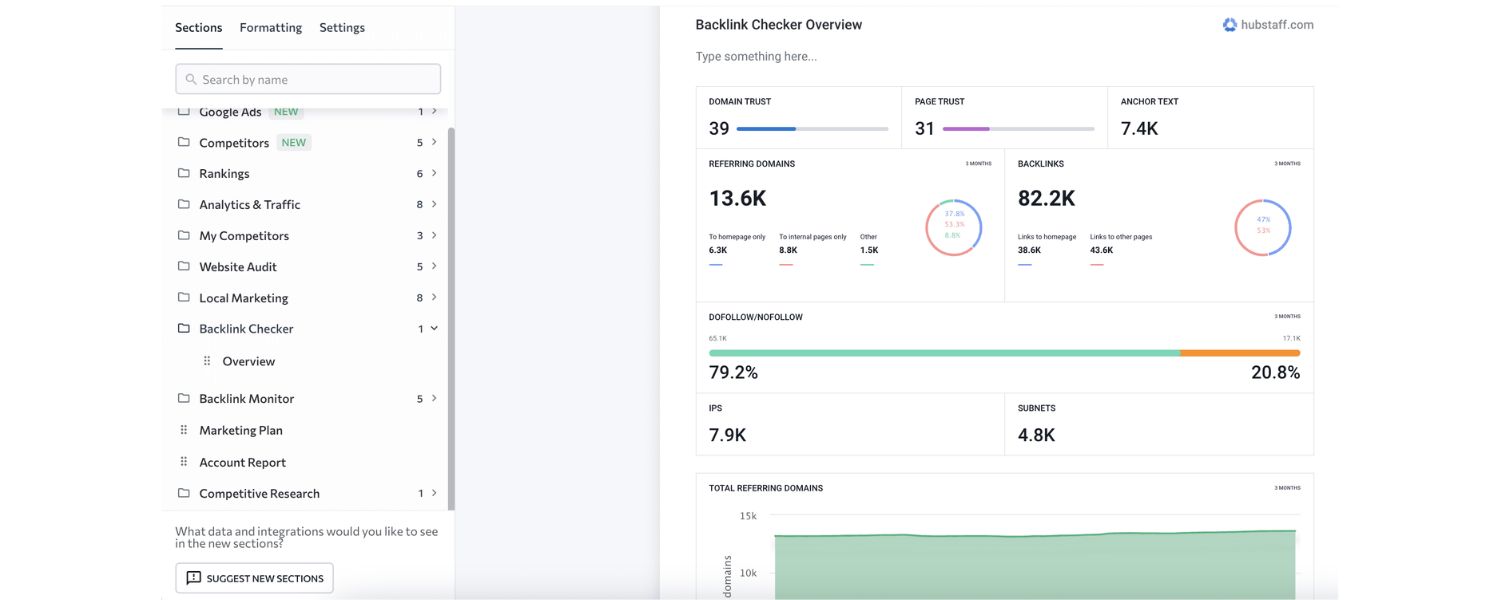
In this section, provide a summary of the site’s backlink status:
A. Total number of backlinks (or referring domains) the site has, and how that changed. For example, “We have 5,200 backlinks from 320 referring domains, up from 4,800 links/300 domains last month.”
B. New backlinks acquired during the reporting period. You could list a few notable new links (e.g. “Got a new backlink from Forbes.com (DA 90) to our blog post”) if appropriate. This showcases your link-building wins. Some SEO reports simply state, “X new referring domains gained this month.”
C. Domain Authority / Domain Rating trend (if you use Moz, Ahrefs, etc. metrics). For instance, “Our domain’s authority score improved from 45 to 50, indicating a stronger link profile.”
D. Backlink quality overview: Emphasize the quality of links over sheer quantity. If possible, report how many high-authority or relevant sites have linked to you. For example, “Out of the new links, 10 were from websites with DA>60. We’re focusing on authoritative links rather than a high volume of low-quality links, as this is best for SEO.”
To make it visual, you might include a small chart of backlinks over time (showing growth) or a pie chart of backlinks by type (e.g. 70% dofollow vs 30% nofollow, or links by industry category, etc., if relevant). However, often a simple bullet list of key backlink stats with a short analysis suffices.
Crucially, explain the implications:
A. Higher authority & trust
You can mention that a “healthy backlink profile is a cornerstone of SEO success” and that increasing quality backlinks will boost the site’s authority and ability to rank.
B. Competitive standing
If you have competitor backlink data, you might subtly mention how you compare. “We’re still 20 referring domains behind Competitor A, but closing the gap.” This can justify ongoing link-building efforts.
C. Link building efforts
If your SEO work includes outreach or content marketing for backlinks, summarize what was done and the results. “This month, we published a guest post on IndustryBlog.com and earned a valuable link back to our site’s homepage.” It reminds the client of the work involved and the payoff.
Also, address any backlink issues if present. For example, if you disavowed toxic links or saw a spike in spammy backlinks, note that you’ve handled it. It’s about showing you are actively managing off-page SEO.
Overall, the message should be: Our link profile is growing stronger, which will help improve rankings. Keep it understandable – many clients might not know “Domain Rating” offhand, so a one-liner explanation (“DR 50 on Ahrefs, which is an indicator of site authority, roughly on par with our top competitors”) can help. Reinforce that you seek quality over quantity, as “high-quality links from authoritative sites signal to search engines that your content is valuable”. This educates the client and sets the right expectations (so they don’t just ask “why not 1,000 new links?”).
7. Technical SEO & Site Health
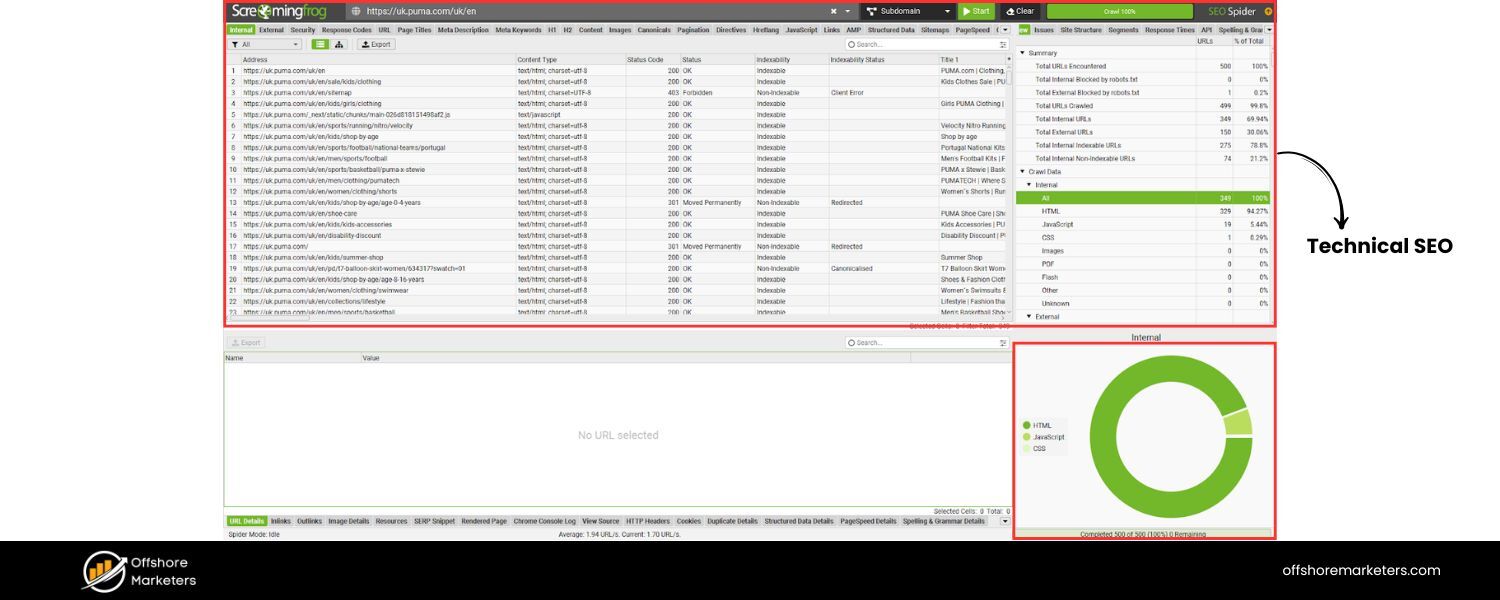
A truly comprehensive SEO report should address technical SEO factors, essentially the health of the website from a search engine’s perspective. Even if the client isn’t technical, it’s important to include a summary of site health, because technical issues can make or break search performance. In this section, you’ll provide an overview of the site’s SEO health and any technical improvements or issues.
Key things to cover:
A. Site Speed and Core Web Vitals
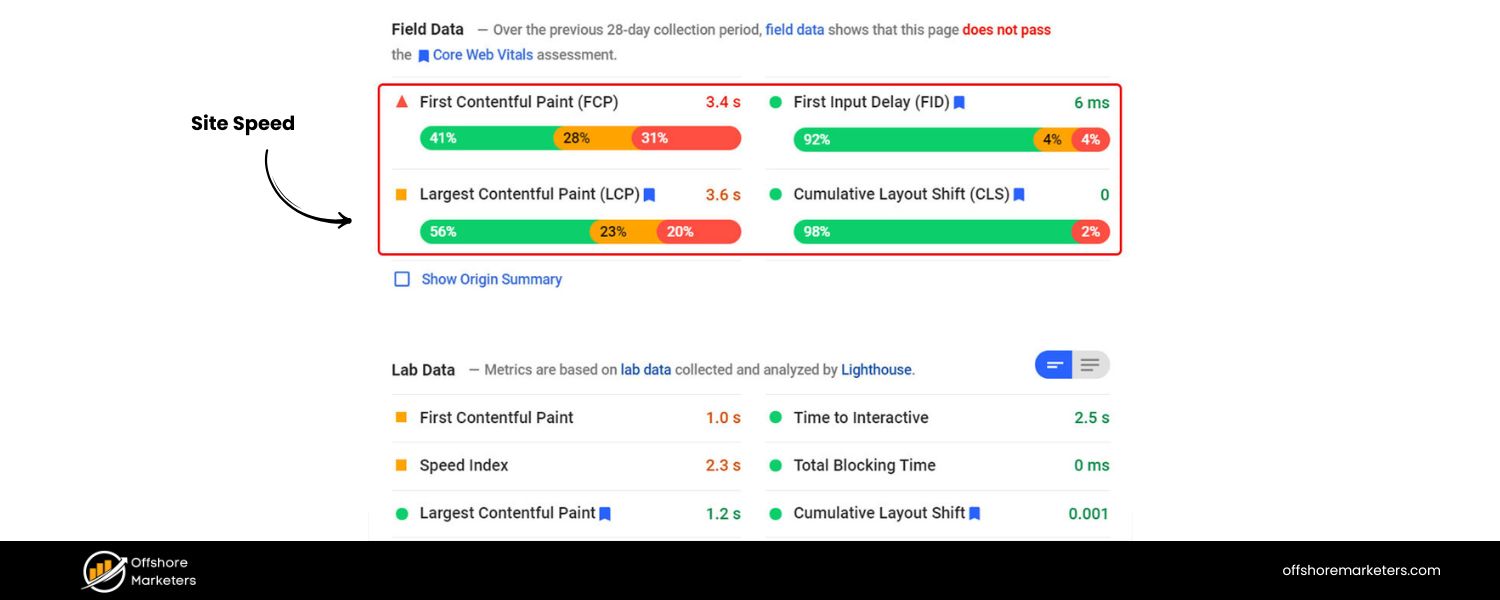
Search engines like Google place high importance on page speed and user experience. If you have Core Web Vitals data (Largest Contentful Paint, etc.) or a PageSpeed score, report the status (e.g. “Mobile page speed score is 85/100, improved from 75 after image optimizations, now in the ‘Good’ range for Core Web Vitals”). Highlight if the site meets Google’s recommended thresholds or if not, what’s being done. Even a simple note like “Page load time is ~3.0s on average, which we are working to improve for better UX and rankings” gets the point across.
B. Mobile Responsiveness
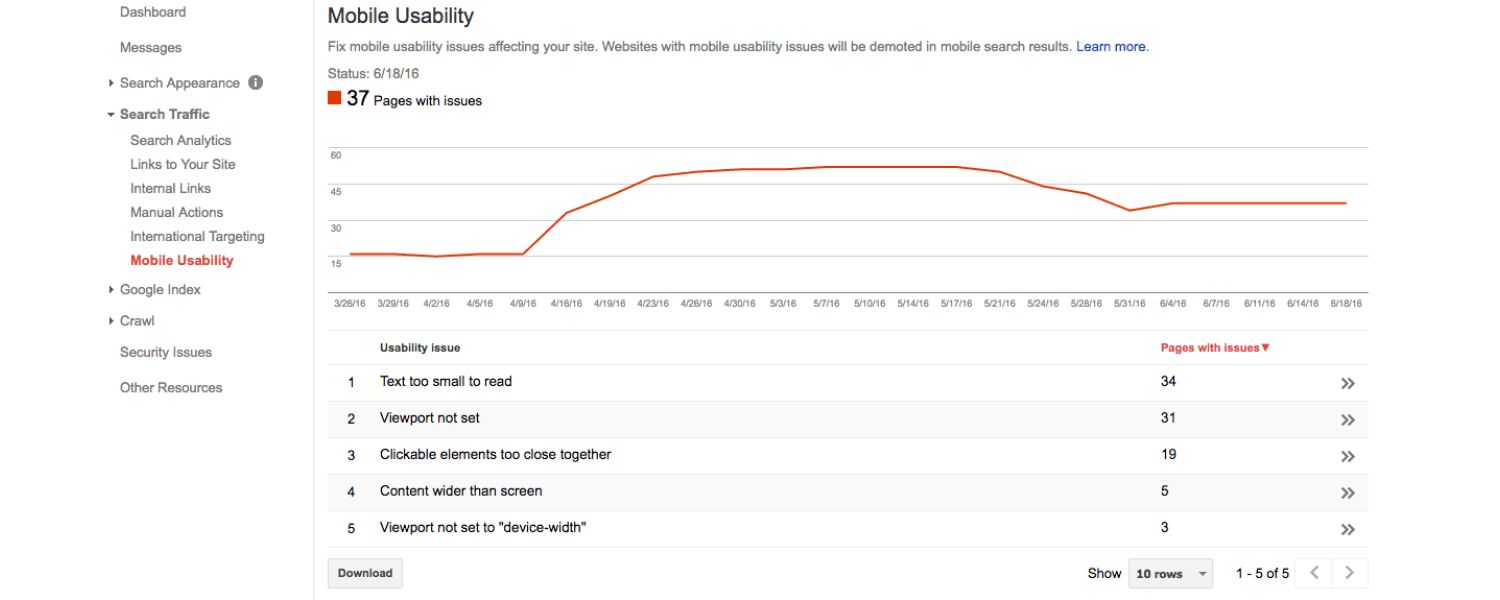
If applicable, mention that the site is mobile-friendly or if there are any mobile usability issues (Google Search Console’s Mobile Usability report can feed this).
C. Indexing and Crawlability
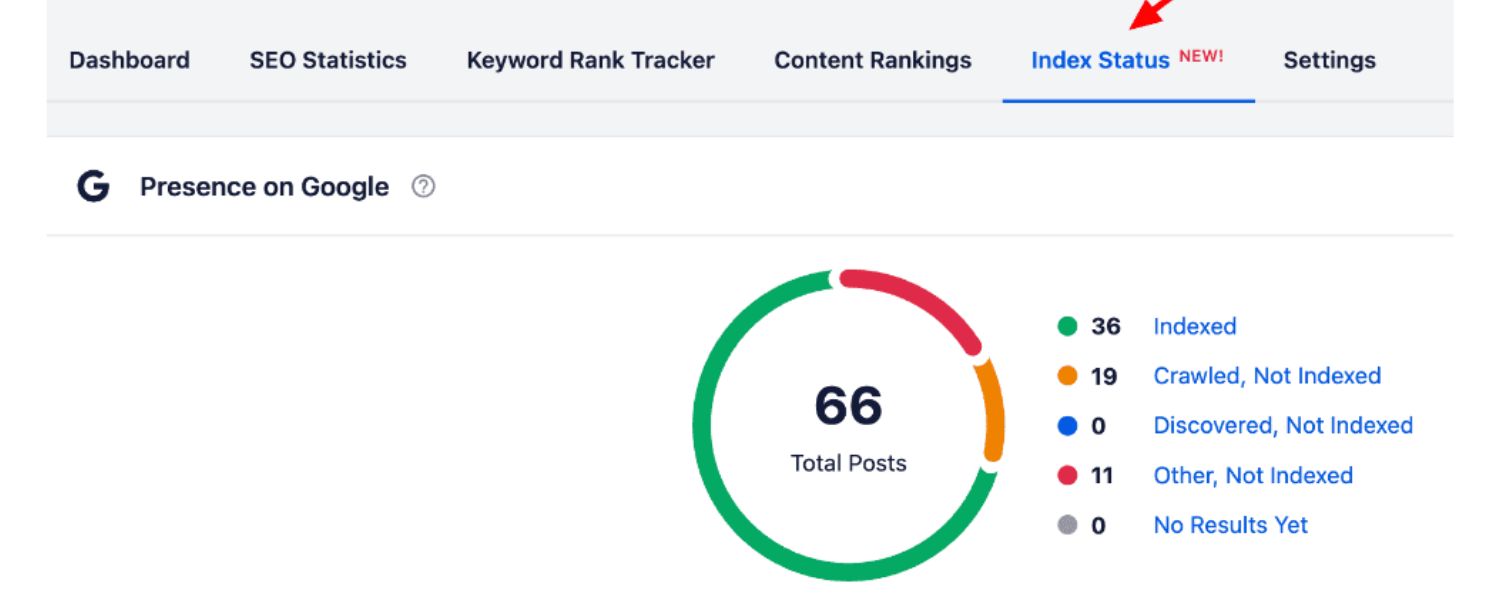
Report how many pages are indexed and if there are any index coverage errors. For example, “Google indexed 500 pages of the site. There were 5 new indexing errors this month (all fixed by adding appropriate redirects).” If you had any crawl errors, broken links, or 404 issues discovered (via Search Console or a crawl tool), list the major ones and note fixes.
D. Security and Core updates
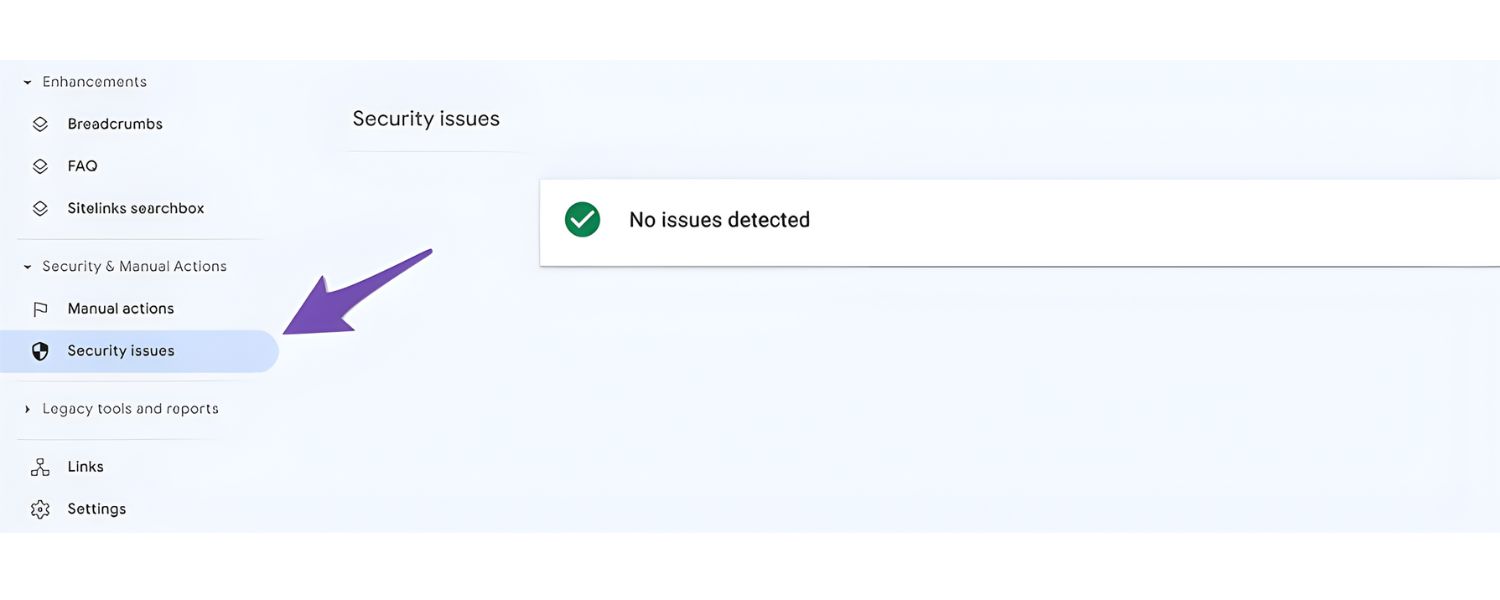
Mention if the site has no manual actions or security issues (you can get this from Google Search Console’s reports). For instance, “No manual penalties or security issues detected – the site is in good standing with Google.”
E. Site Health Score
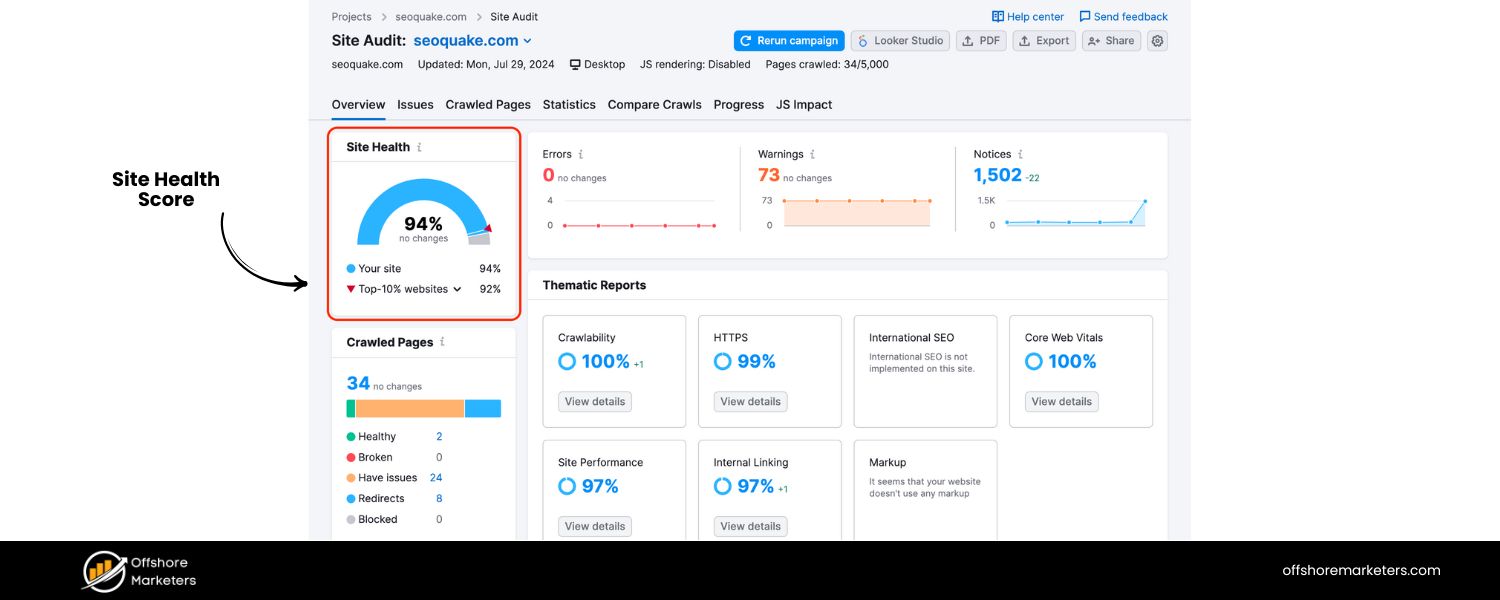
If you use an SEO auditing tool that gives a health score or grade (e.g. “A-” or “92/100”), you can include that as a one-glance indicator. “Our latest site audit scored 92%, which is excellent – only minor issues found.”
F. Notable technical fixes or changes
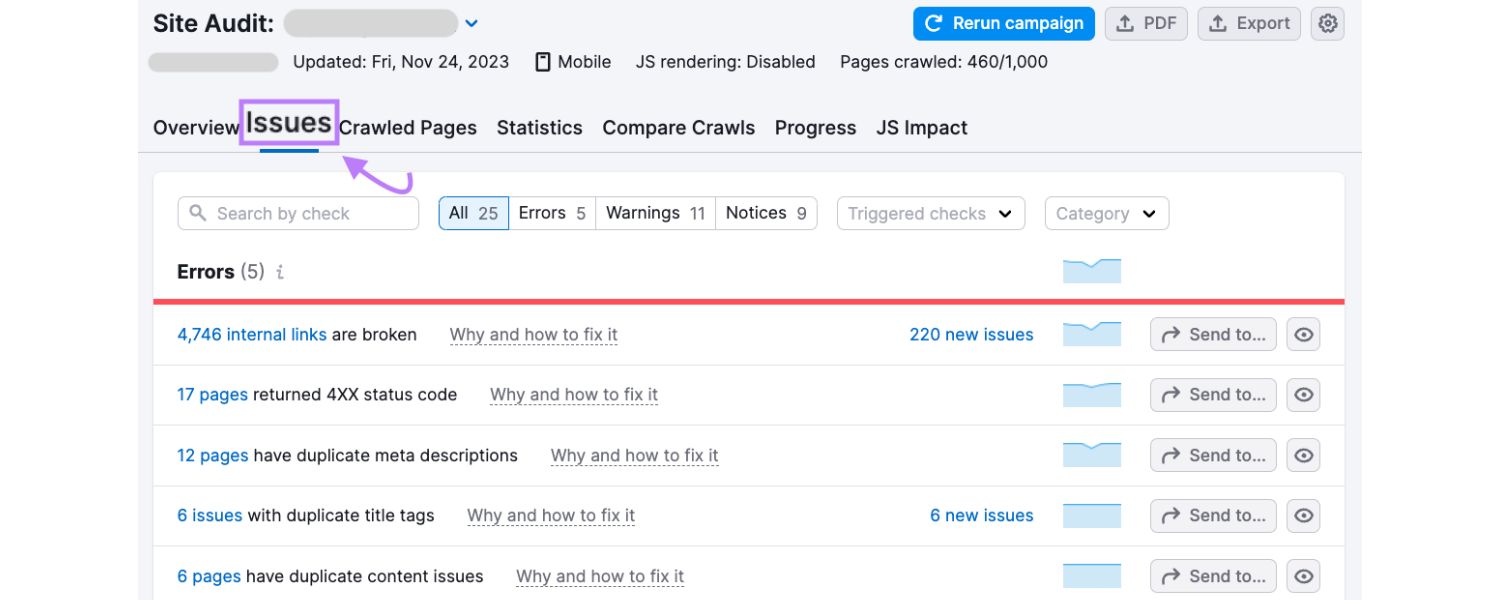
Briefly mention any technical SEO work done recently, like “Implemented schema markup on product pages,” “Fixed duplicate meta descriptions,” or “Added an XML sitemap and submitted to Google.” This shows proactive maintenance.
It’s often helpful to phrase this section in terms of ongoing monitoring. For example: “We run regular SEO audits to catch issues – the latest audit shows the site is well-optimized with only a few low-priority warnings.” Emphasize how a well-optimized, healthy site improves rankings and user experience. You can note that a technically sound site not only helps search crawlers index content efficiently but also keeps users happy (faster site, no broken pages, etc.), which indirectly benefits SEO as well.
If there were any significant technical issues recently, transparently report them along with solutions. For example, “We discovered that 50 product pages were inadvertently set to ‘noindex’ (thus not appearing in Google). This was fixed in early August, and those pages are now indexed and starting to rank.” This turns a potential negative into a demonstration of your vigilance and expertise.
Many clients may skim this section if they’re not technical, so keep it high-level and results-oriented. Instead of delving into code, talk about outcomes: “The site is technically healthy – no critical SEO errors, which provides a strong foundation for our ongoing content and link efforts. We’ll continue to monitor site health through monthly audits and Search Console.” That gives reassurance that nothing “under the hood” is undermining their SEO.
8. Recommendations & Next Steps
Conclude the main body of your SEO report with a section on Recommendations (or Action Plan). This is where you turn data into a forward-looking strategy. Based on everything above, what do you propose to do next to improve SEO performance?
Clients and stakeholders love this section because it answers, “So, what’s next? Where do we go from here?” It also positions you not just as a reporter of data, but as a strategic partner actively seeking improvement.
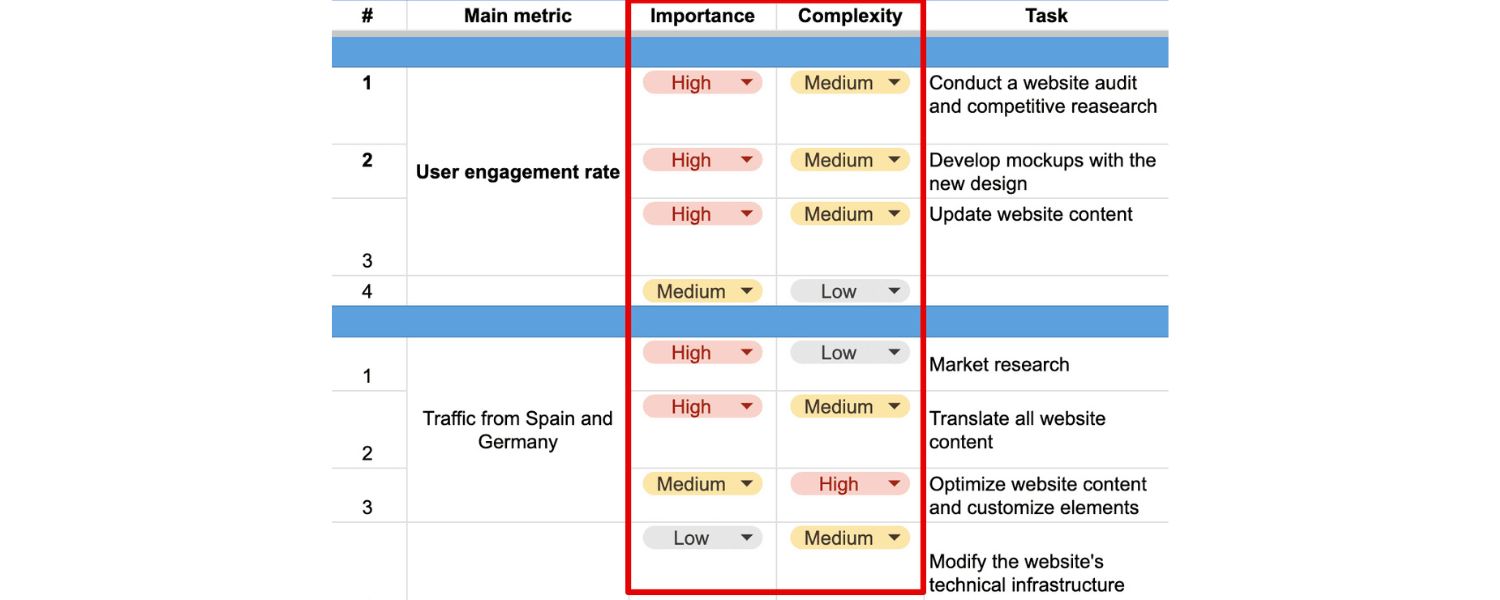
Structure this section as a bullet list of priority actions or focus areas for the next period. Group them by theme if helpful (content, technical, link-building, etc.) and indicate priority (e.g. High/Medium/Low). For example:
A. High Priority – Improve Conversion Rate: The report showed lots of traffic but a slight dip in conversion rate. Action: Conduct A/B tests on the top landing pages and implement improvements (e.g. clearer CTAs, faster load times) to boost conversions.
B. High Priority – Technical Fixes: Resolve the remaining site health issues. Action: Fix broken links and remove duplicate meta descriptions identified in the audit to ensure a clean crawl by Google.
C. Medium Priority – Content Expansion: Build on our successful content. Action: Write 2 new blog posts targeting related keywords to “{High-performing Keyword}” since that topic drove strong traffic and engagement. Update the popular “Guide to X” post with fresh info to maintain its rankings.
D. Medium Priority – Backlink Outreach: Continue growing high-quality backlinks. Action: Publish an infographic next month and reach out to industry sites for links. Aim to earn 5–10 new authoritative links by next report.
E. Low Priority – Schema Markup: Add FAQ schema to the FAQ page to enhance its search snippets (nice-to-have that could improve click-through rates).
Each recommendation should tie back to report insights. If you noted a weakness or opportunity earlier, here you’re closing the loop by proposing what to do about it. For instance, if the SEO report revealed a drop in one important keyword ranking, a recommendation might be “Optimize [Keyword] page – update content and build 2 new backlinks to regain lost ranking.” Or if mobile page speed was lagging, a task would be “Implement further image compression and consider a CDN to speed up mobile load times.”
Be sure to also communicate any ongoing initiatives so the client knows all the work that’s in progress. Even something like “Continue monitoring competitor SEO moves (Competitor B is ramping up their blog, we will keep an eye on their new content)” can be mentioned, though focus on direct actions you’ll take.
Finally, end on a positive and proactive note. As a best practice, always conclude reports with optimism and confidence – even if there were some downtrends. For example: “Despite some challenges this month, we have a clear plan to tackle them. With these upcoming improvements and our continued SEO efforts, we’re confident we’ll see even better results in the next report.” This leaves stakeholders feeling assured that you are not only reporting issues but actively solving them.
By presenting recommendations, you reinforce the idea that SEO reporting isn’t just retrospective – it’s part of a continuous improvement cycle. Each report informs the strategy moving forward. Clients will appreciate that you’re already thinking about how to drive even more growth, rather than resting on past achievements. It shifts the conversation from “look what we did” to “look what we’ll do next,” which is key to ongoing success and client retention.
Best Practices for SEO Reporting Success
Before we wrap up, it’s worth highlighting a few best practices to ensure your SEO reports are effective, reader-friendly, and SEO-friendly (yes, you want your report to shine even if an AI like ChatGPT or Bing summarizes it!). These tips come from seasoned marketing experts and can help elevate your reports from good to great:
A. Keep it Client-Centric
Always consider your audience’s perspective. Tailor the depth of data and language to their understanding. If your client or boss isn’t very technical, avoid jargon – explain things like “click-through rate” or “Core Web Vitals” briefly when they appear, or include a glossary footnote. Focus on the metrics they care about most (usually traffic, leads, sales). As one agency expert advises, “SEO reporting shouldn’t overcomplicate things with extra metrics to try to impress.
It should clearly state, in plain English, what your clients really want to know.” In practice, that means emphasizing results against goals, and actions taken, rather than drowning them in data points that don’t align to their objectives.
B. Use a Logical, SEO-Friendly Structure
Organize your report with clear headings and sections (as we’ve outlined above). A logical flow – Summary → Performance metrics → Analysis → Action Plan – helps readers quickly find what they need. It also helps search engines or AI tools parse the content if the report is on a webpage. Use descriptive headings (e.g. “Organic Traffic Trend Q4 2024”) and include relevant keywords naturally in your subheadings (like “SEO traffic”, “keyword rankings”) – this not only reinforces the SEO topic but also can enable rich snippet outlines if you publish the report online.
C. Leverage Visuals and Data Storytelling
Charts, graphs, and tables are your friends. Visual elements break up text and convey data at a glance. Use line charts for trends over time, bar charts or pie charts for breakdowns, and tables for precise values. Ensure each visual has a clear label or caption. For example, include a chart for traffic by source, a table for top keywords, or a screenshot from Google Analytics or Search Console highlighting a key point.
Visuals not only make the report more engaging but also cater to “visual learner” clients who grasp pictures faster than paragraphs. Just remember to explain the takeaway of each visual in the text (don’t assume the insight is obvious). Graphical elements can make complex SEO data easier to understand – especially for stakeholders unfamiliar with SEO concepts.
D. Provide Context for Every Metric
Numbers in isolation can be misleading or confusing. Always contextualize the data. If you state “Organic sessions = 10,000”, add context like “…which is a 20% increase compared to last month” or “…which accounts for Fifty percent of total site traffic”. If a metric went down, explain possible reasons (seasonality? a Google update? site changes?) and what’s being done. If it went up, explain why (successful content, improved rankings, etc.) and how to continue that trend.
Think of your report as a narrative, it should read like a story of the campaign’s performance, not just a dashboard. Insight is what clients truly value, not just data. As one guideline suggests: don’t simply share data, provide insights and explain trends or anomalies in the metrics. That turns your report from a raw log into a meaningful evaluation.
E. Stay Action-Oriented and Positive
Frame your report in terms of actions and outcomes. Where possible, highlight successes (“wins”), even small ones like a slight uptick in CTR or a new keyword on page 1. This keeps morale up. When discussing challenges, immediately follow with planned actions to address them (as we did in Recommendations). Also, end sections or the whole report on a positive note, summarizing progress made and expressing confidence in continued growth.
For example: “Overall, the SEO metrics are trending in the right direction, our efforts are clearly paying off, and with the planned optimizations, we anticipate even stronger performance next month.” This doesn’t mean sugarcoat problems, but always pair problems with solutions and maintain an optimistic, proactive tone.
F. Incorporate Latest Data and Updates
Ensure your report includes fresh data (2024/2025) where relevant, outdated stats can hurt credibility. Use up-to-date research or benchmarks to support your points. For instance, you might reference that “According to 2024 industry benchmarks, our 5% organic conversion rate is above the median of ~2%” to show the client they’re doing well.
If Google launched a new feature or algorithm in the period, mention how you’ve adapted or monitored its impact (e.g. “Google’s August 2024 core update caused volatility, we saw minor ranking shifts but largely held strong, reflecting our site’s solid quality”). Staying current in your analysis proves you’re on top of the latest SEO developments.
G. Use Tools and Automation to Your Advantage
Lastly, streamline the reporting process so you can focus on analysis. Use SEO reporting tools or dashboards to gather data from multiple sources (Google Analytics, Search Console, Ahrefs, etc.) in one place. Many tools allow scheduling automated reports or one-click exports. For example, Google Looker Studio (formerly Data Studio) can combine GSC and GA data into a shareable dashboard, or an SEO platform like Semrush or AgencyAnalytics can pull in keyword, backlink, and technical data into a single PDF.
Automating the data collection can save hours, letting you invest time in interpreting the results and customizing the narrative. As Semrush notes, SEO reporting can be time-consuming, so it’s helpful to automate as much as possible, even scheduling reports to email out on a set cadence. Just be sure to review automated reports for accuracy and add your commentary, never send raw data without explanation.
By following these best practices, your SEO reports will be insightful, credible, and engaging, truly a reflection of your 25+ years of marketing expertise. A great SEO report not only keeps everyone informed but can also serve as a showcase of your agency’s or team’s professionalism and strategic value.
Conclusion & Call to Action
In today’s data-driven marketing landscape, an SEO report is far more than a routine document, it’s the bridge between your SEO work and the results that decision-makers care about. A well-crafted SEO report helps clients and stakeholders see the big picture: how far you’ve come, what’s driving success, and where the opportunities lie. It builds trust by showing transparency and expertise, and it keeps the momentum going by outlining the roadmap ahead. In essence, it turns the art of SEO into a concrete narrative of growth and value.
By incorporating the elements we’ve discussed, from traffic and rankings to conversions, site health, and clear recommendations, your SEO reports will stand toe-to-toe with the best in the industry. You’ll be providing more depth, more up-to-date insights, and more actionable takeaways than any generic report. Whether someone reads it on Google, Bing, or an AI assistant, your comprehensive report could even be considered “wiki-worthy”, useful in any year as a go-to reference on SEO reporting done right.
Now, it’s time to put this knowledge into action. Ready to level up your SEO reporting and outperform your competitors? Start by applying these principles to your next report. And if you need a helping hand or a smart tool to simplify the process, we’ve got you covered. Try our free SEO Report Analyzer to instantly audit your website and generate a detailed SEO report with actionable recommendations, no hassle, no cost. Let us help you turn your data into growth!
Create reports that not only inform, but inspire action. Your clients (and your future self) will thank you when they see the results. Here’s to your SEO reporting success!

.png)
Shopify SEO: Guide to Ranking Your Store and Driving Sales
Most Shopify store owners set up their store, list their...

Content Marketing : Definitive Guide to Strategy, Content Types, and Measurable ROI
Content marketing generates 3x more leads than outbound marketing at...

Above the Fold: Guide to Conversions, Rankings and Faster Pages
Above the Fold in 2026: The Complete Guide to Conversions,...

Off-Page SEO Checklist: Guide to Building Real Authority
Most websites spend months creating great content, only to wonder...

What Is Keyword Bidding? The Complete Strategy Guide for Smarter Ad Spend
Most advertisers believe the highest bid wins the auction. It...
What Is Google Trends? The 2026 Marketer’s Complete Guide
If you are not already pulling weekly insights from Google...
If you want a growth partner who will get to know every aspect of your business and treat your budget like their own — we are the right fit.
.png)
.png)
.png)
.png)
.png)
.png)
2026 ALL RIGHTS RESERVED MADE IN INDIA