Google PageSpeed Insights: Guide to Boost Site Speed & SEO
August 13, 2025
Introduction
Nothing frustrates users more than a slow website. Slow load times disrupt the user experience and hurt your conversion rates. From an SEO perspective, Google PageSpeed Insights is a crucial tool because Google is less likely to rank pages that take too long to load. In fact, 53% of mobile visitors will abandon a site that takes more than 3 seconds to load.
This is where Google PageSpeed Insights (PSI) comes in, a free tool that analyzes your webpage’s performance and provides actionable recommendations to improve speed. With Google PageSpeed Insights, you can pinpoint issues that are slowing down your website and implement the necessary fixes to ensure a faster, more efficient user experience.
In this comprehensive guide, we’ll explain what Google PageSpeed Insights is, why site speed matters, how to use and understand PSI reports, and proven techniques to make your site faster and more efficient.
By utilizing Google PageSpeed Insights, you can ensure that your site meets both user expectations and SEO requirements, ultimately boosting your search rankings and conversion rates.
What Is Google PageSpeed Insights?
Google PageSpeed Insights (PSI) is a free performance analysis tool from Google that evaluates the content of a given webpage and generates page speed scores for both mobile and desktop.
In simple terms, Google PageSpeed Insights measures how fast your page loads and how stable and responsive it is for users. It then provides an overall Performance score (ranging from 0–100) and a list of actionable recommendations to help you make that page faster.
Google PageSpeed Insights is part of Google’s broader web performance initiative, using Google’s Lighthouse engine under the hood to perform a series of lab tests on your page. Additionally, it integrates real-world user data from the Chrome User Experience Report (CrUX), reflecting how actual users experience your site over the past 28 days.
This combination of lab data and field data makes Google PageSpeed Insights a unique and invaluable tool for webmasters, developers, and marketers who are looking to improve site speed. With Google PageSpeed Insights, you can enhance user experience, boost your SEO rankings, and optimize overall site performance.
Some key features of Google PageSpeed Insights include:
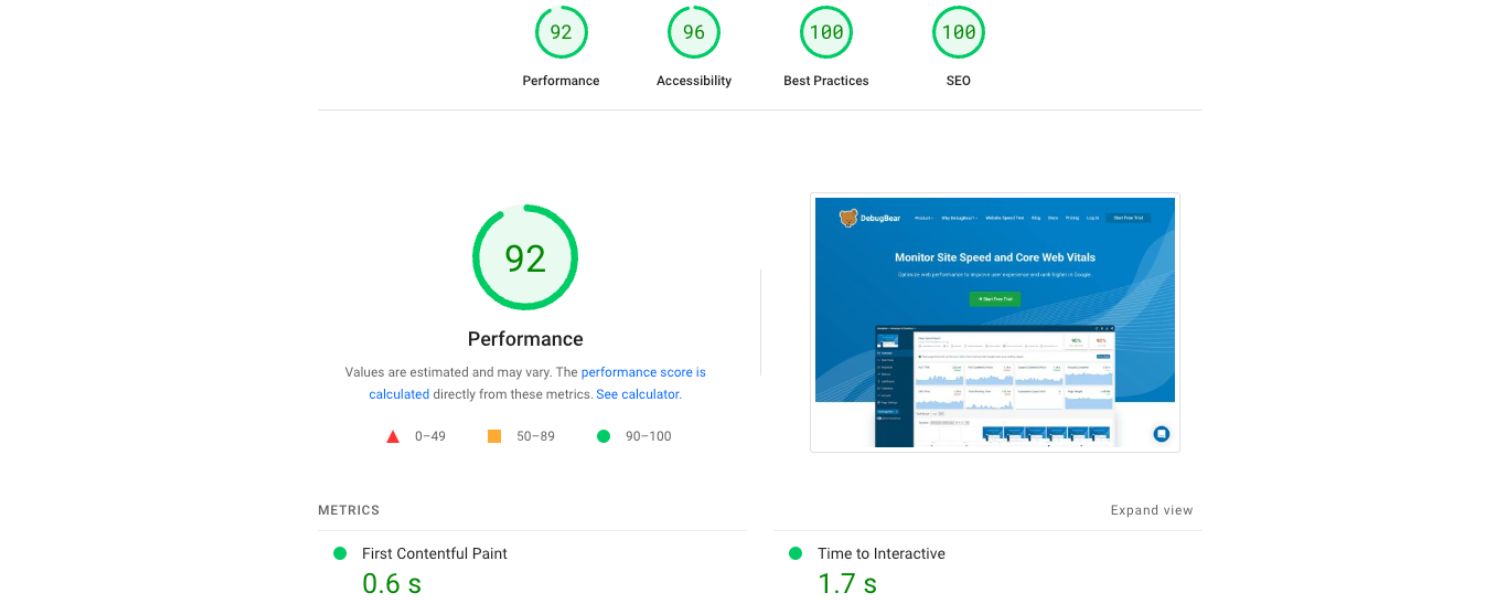
A. Performance Score: A number from 0 to 100 summarizing your page’s overall performance (90+ is “good”, 50–89 “needs improvement”, below 50 “poor”). This score is calculated directly from various lab metrics (more on these shortly).
B. Core Web Vitals Assessment: A pass/fail evaluation of your page’s Core Web Vitals, crucial user experience metrics for loading, interactivity, and visual stability.
C. Detailed Metrics: PSI reports key performance metrics like First Contentful Paint, Largest Contentful Paint, Cumulative Layout Shift, etc., with their values and thresholds.
D. Opportunities & Diagnostics: A list of specific suggestions (e.g. “Eliminate render-blocking resources”) with estimated load time savings, and additional diagnostic info on what your page is doing well or could improve.
E. Mobile and Desktop Analysis: PSI provides separate results for mobile and desktop views of your page, since performance can differ by device. You can switch between the two tabs in the report.
In essence, PageSpeed Insights is like a report card for your webpage’s speed and user experience. Next, we’ll see why these factors are so important.
Why Website Speed Matters (SEO & User Experience)
Website speed isn’t just a technical nicety, it has real impacts on SEO rankings, user satisfaction, and business bottom line. Let’s break down why improving your PageSpeed Insights score (and your actual page load times) should be a top priority:
1. SEO and Rankings
Google has confirmed that site speed is a ranking factor for search results. Since 2018, page load speed (especially on mobile) has been officially incorporated into Google’s ranking algorithms.
While the PSI score itself is not a direct ranking factor (it’s a diagnostic tool), many of the metrics it measures, particularly the Core Web Vitals (Largest Contentful Paint, First Input Delay/INP, Cumulative Layout Shift), are part of Google’s Page Experience ranking signals.
In short, a slow site can hurt your SEO. All else being equal, faster websites are considered more “user-friendly” and may get a boost in search visibility.
2. User Experience and Conversions
Users today expect web pages to load very quickly (often within 2–3 seconds). If your site is sluggish, visitors are more likely to bounce (leave immediately) or become frustrated. In fact, a one to three-second increase in page load time makes visitors 32% more likely to bounce.
And the longer the wait, the worse it gets, as page load goes from 1s to 6s, the probability of a user bouncing increases by over 100%.
Slow speeds also hurt conversions and sales: one study found that each additional second of load time beyond the first 5 seconds causes conversion rates to drop by an average of 4.42%. Customers simply prefer fast websites – 53% of mobile users will abandon a site that takes over 3 seconds to load, and they’re less likely to buy or return to a slow site.
Google’s own research shows that for every 1-second delay in mobile page load, conversions can fall by up to 20%. This is where Google PageSpeed Insights becomes an invaluable tool to measure and improve your site’s speed.
3. Reputation and Engagement
Speed is part of your brand’s first impression. A fast, responsive site signals professionalism and reliability. Users are more likely to stay longer, browse more pages, and engage with content if the experience is snappy.
On the other hand, a slow site can damage your credibility, 79% of shoppers who experience poor site performance say they won’t return to that site. In an era of short attention spans, no one wants to wait around for a page to load.
By improving your Google PageSpeed Insights metrics, you’re also improving the underlying user experience (UX), which leads to higher satisfaction and potentially better word-of-mouth. As your site speeds up, users are more likely to stay engaged, increasing time on site and reducing bounce rates, which directly impacts your business performance.
The Bottom Line
In summary, speed is a win-win: search engines reward it, users love it, and it directly impacts your business metrics (bounce rate, conversion rate, revenue). Google PageSpeed Insights is a tool to help you achieve that speed.
By using PSI to analyze and improve your site’s load times, you ensure that your business stays competitive and responsive to your audience’s needs. Before we dive into using Google PageSpeed Insights, let’s understand how it works under the hood.
How Google PageSpeed Insights Works (Lab Data vs. Field Data)
Google PageSpeed Insights gathers two types of performance data about your page: lab data (synthetic tests in a controlled environment) and field data (real-user measurements from the wild). Understanding these will help you interpret the PSI reports correctly.
A. Lab Data (Lighthouse)
When you run a PSI test, Google uses Lighthouse, an open-source performance audit tool, to load your page in a simulated environment (by default, a mid-tier mobile device on a slow 4G network).
Lighthouse generates lab data: it measures your page’s performance on a set of metrics in this controlled scenario. This includes timings like First Contentful Paint, Speed Index, Time to Interactive, etc., all gathered in one test session.
Lab data is useful for debugging because it’s consistent and repeatable, you can run it multiple times to see how changes affect the metrics. However, it might not capture all real-world bottlenecks, since it’s an emulated test. The lab data is what directly feeds into your PSI Performance score.
B. Field Data (Real User Experience)
PageSpeed Insights also shows field data from the Chrome User Experience Report (CrUX), when available. This is data collected from actual Chrome users who visited your page (or other pages on your site) over the last 28 days.
It includes the Core Web Vitals metrics: e.g., how fast the page’s Largest Contentful Paint (LCP) was, the Interaction to Next Paint (INP) or previously First Input Delay, and Cumulative Layout Shift (CLS) as experienced by real users.
Field data is valuable for capturing true user experience, accounting for various devices, network conditions, and user behaviors in the real world. However, it provides a limited set of metrics and only appears if enough data exists (for popular sites or pages). Field data does not directly affect the 0–100 performance score, it’s presented for diagnostic purposes alongside the score.
In essence, PSI’s lab data tells you how your site performs in a controlled test and powers your score, while field data tells you how your site performs for actual users. Often, you’ll see that your lab and field results don’t exactly match – this is normal.
For example, your lab test might show a certain load time, but real users (field data) could experience slower speeds due to older devices or slower networks. Both perspectives are useful: lab data helps you debug and optimize in a consistent setting, and field data ensures you don’t lose sight of real-world outcomes.
How the Performance Score is Calculated:
The PSI performance score (0–100) is computed from a weighted combination of several lab metrics measured by Lighthouse.
As of 2025, Lighthouse v12 (used by PSI) includes six key metrics in the performance score calculation:
- First Contentful Paint (FCP) – how quickly the first text or image is painted.
- Largest Contentful Paint (LCP) – how quickly the largest element (e.g. hero image or heading) is painted.
- Speed Index (SI) – how quickly content is visually populated (average perceptual speed).
- Time to Interactive (TTI) – how long until the page is fully interactive (no long tasks blocking the main thread).
- Total Blocking Time (TBT) – the total time that the page was blocked from responding to user input (related to long JavaScript execution).
- Cumulative Layout Shift (CLS) – how much the page layout shifts unexpectedly (visual stability).
Each metric is given a certain weight in the score (with LCP, TTI, and TBT typically having higher influence). Lighthouse then calculates the score by comparing your metrics to global performance distributions (the 75th percentile of real site data) and assigning a value 0–100.
Google classifies scores into color-coded ranges: 90–100 (green) = Good, 50–89 (orange) = Needs Improvement, 0–49 (red) = Poor. Keep in mind that the score is an estimate of performance. It can vary between tests due to randomness or different test conditions, so focus on consistently improving the underlying metrics rather than chasing a perfect 100.
Core Web Vitals:
In the PSI report, Google prominently features the Core Web Vitals assessment using field data. Core Web Vitals (CWV) are a subset of metrics deemed critical for user experience: currently LCP (loading performance), INP (or FID – responsiveness), and CLS (visual stability).
To “pass” the Core Web Vitals assessment, a page (or site) must have all three metrics in the “Good” range for the 75th percentile of users. The thresholds for “Good” are: LCP under 2.5 seconds, INP (interaction delay) under 200 milliseconds, and CLS less than 0.1.
(Note: INP replaced the older FID metric as the primary responsiveness metric in March 2024. INP measures overall interaction latency during a page visit, providing a more holistic view of responsiveness.)
If your page’s 75th percentile metrics meet the targets, you earn a “✅ Passed” badge for Core Web Vitals in PSI; if not, it will show which ones need improvement. Since Google uses Core Web Vitals in its ranking algorithm, this is an important section to monitor.
Now that we’ve covered what PSI is measuring, let’s go step-by-step through using the tool and making sense of the report it generates.
How to Use the Google PageSpeed Insights Tool
Using Google PageSpeed Insights is straightforward and free – you don’t need to install anything. Here’s how to test your website’s speed using PSI:
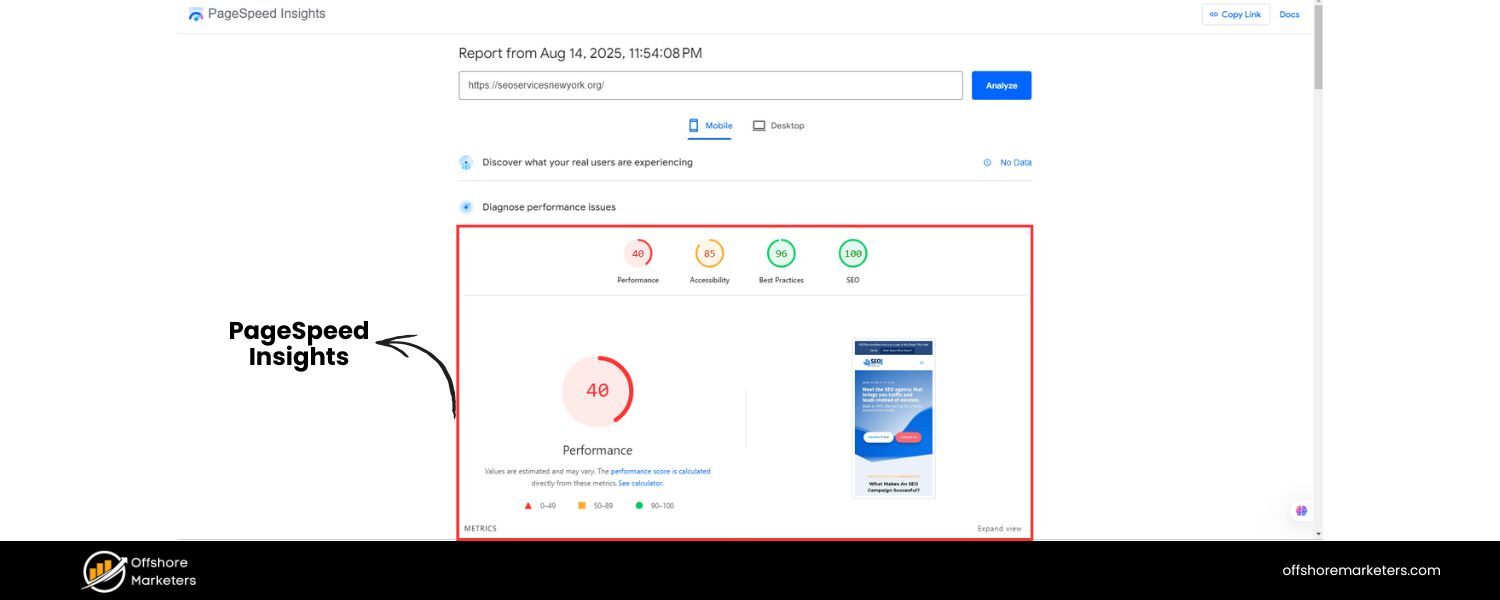
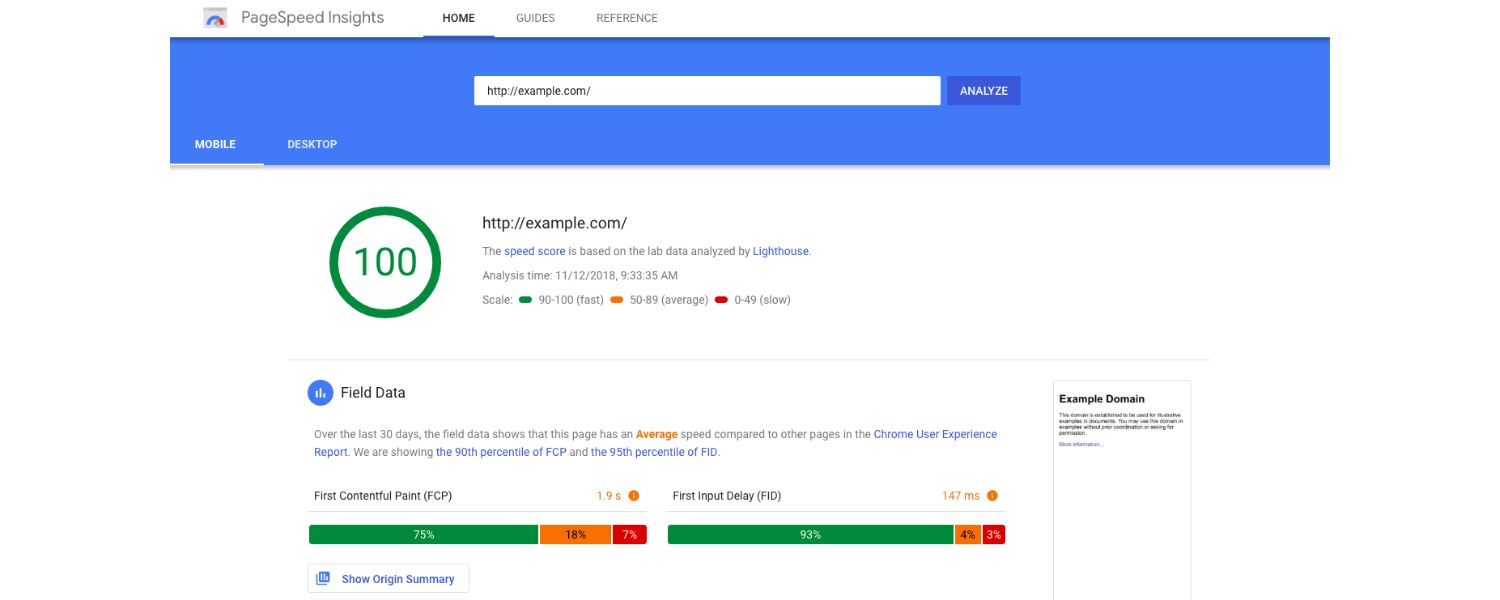
Figure: The Google PageSpeed Insights interface – enter a webpage URL and click “Analyze” to get your performance report.
1. Visit the PSI Website
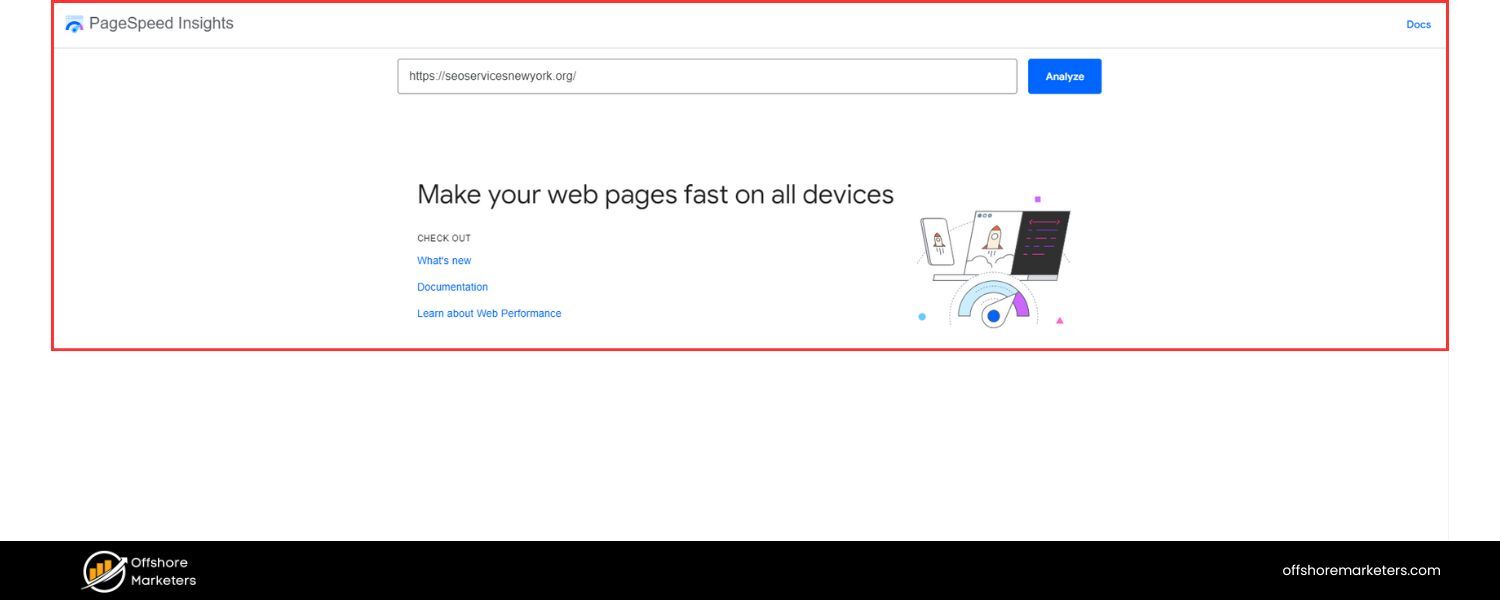 Go to pagespeed.web.dev (the official PageSpeed Insights page). You’ll see a simple interface with a text box.
2. Enter Your Page URL
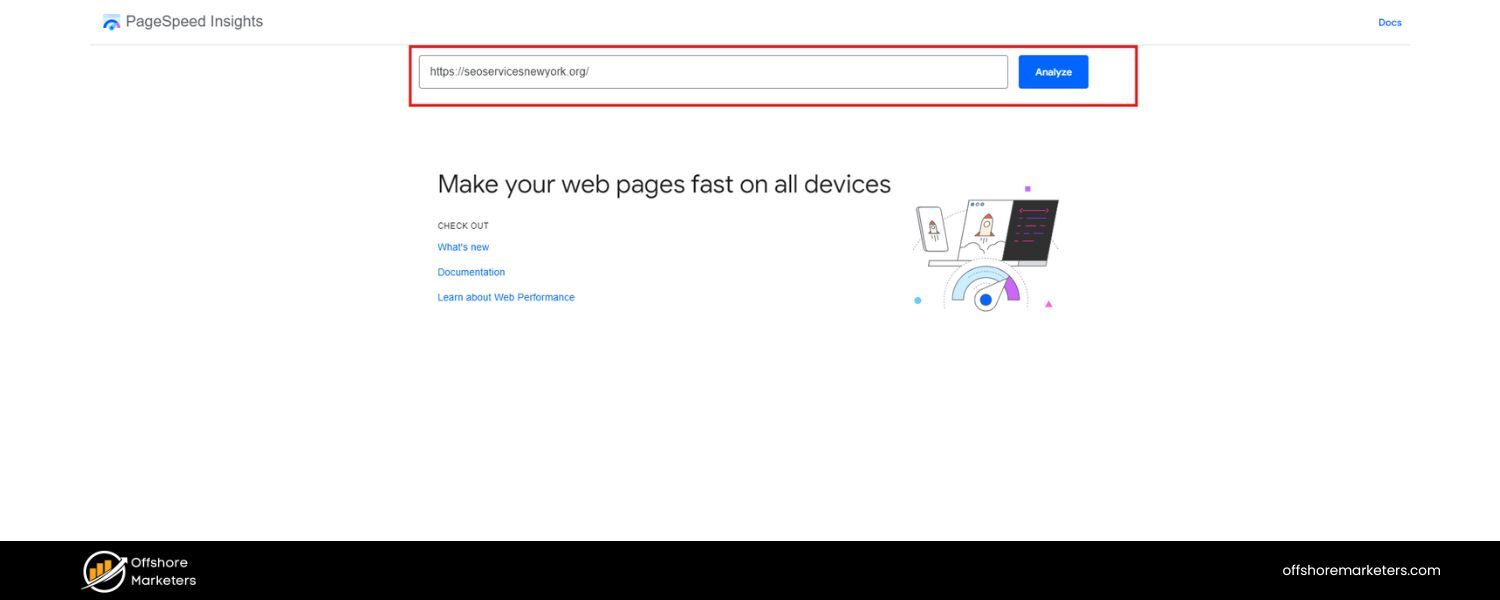 Type or paste the full URL of the page you want to analyze (e.g. https://www.your-site.com/your-page). You can test any publicly accessible webpage – it doesn’t have to be your own domain. (Tip: Test important pages like your homepage, product pages, blog posts, etc., as speed can vary per page.)
3. Choose Device (if needed)
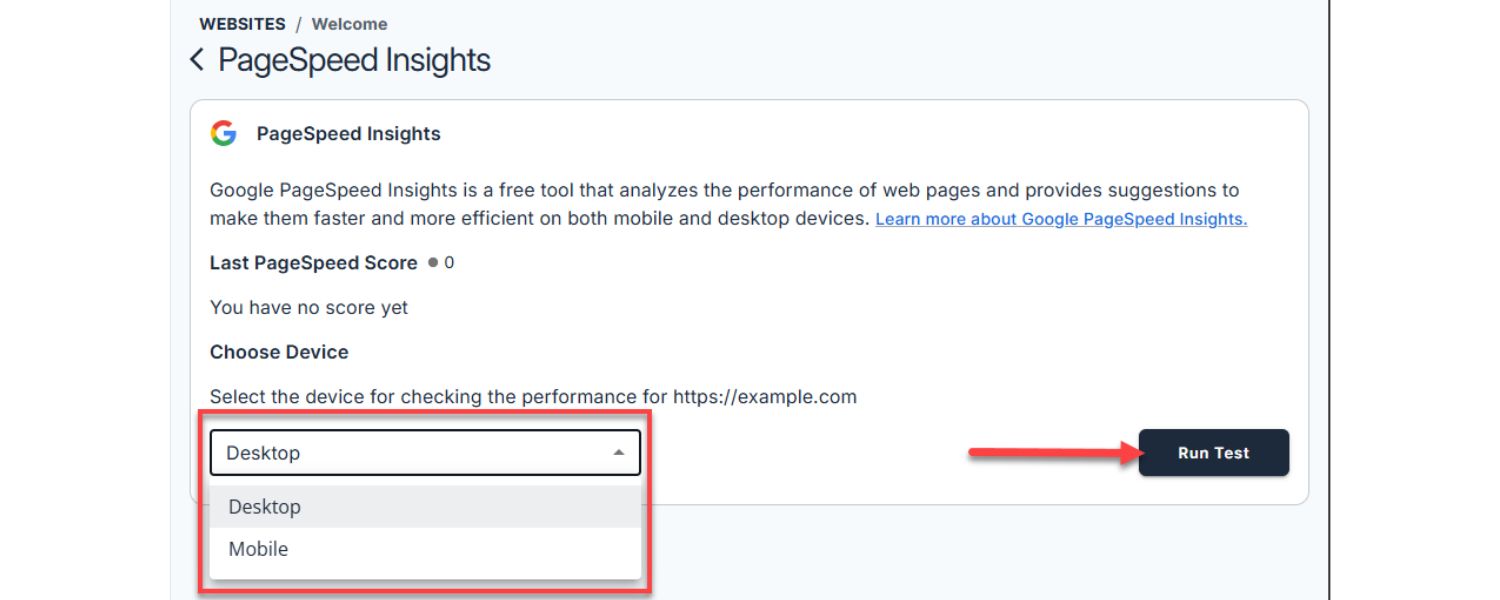
By default, PSI will show mobile results first. After the analysis, you can switch between Mobile and Desktop tabs at the top of the report to see performance on each. Mobile is often more stringent due to slower network/device simulation. It’s a good idea to check both.
4. Click “Analyze”
 Hit the Analyze button. PSI will begin fetching the page and running tests. It usually takes about 20–30 seconds to analyze, as Google is running the Lighthouse performance audit and pulling field data. You’ll see a loading spinner while it works.
5. View Your Results
Once complete, PSI will display your Performance score and a breakdown of results (we’ll explain each part in the next section). You can scroll to see Field Data (Core Web Vitals), Lab Data metrics, Opportunities, Diagnostics, and Passed Audits. There’s also a screenshot of your page loading and a timeline if you click into Lighthouse details.
6. Save or Share
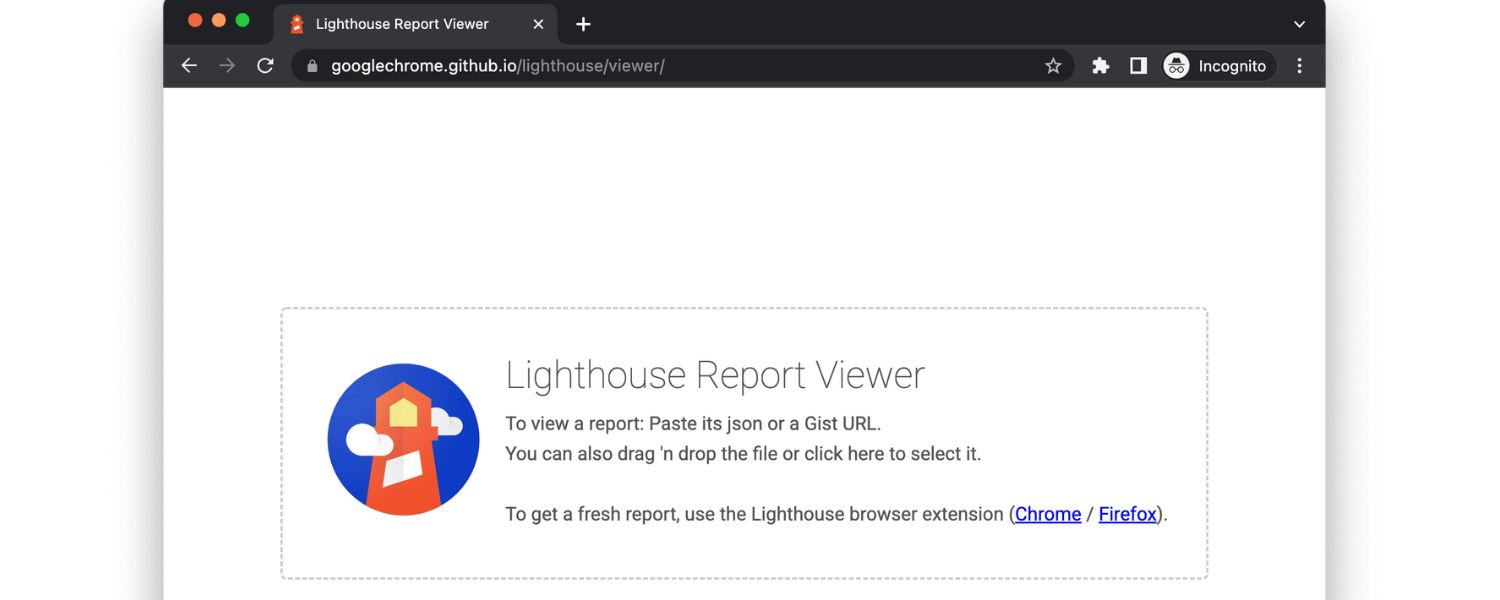
You can copy the report link from your browser to share with teammates. There’s also an option to download the Lighthouse JSON results if you’re into technical analysis or want to use the PageSpeed Insights API for monitoring.
PSI is easy to use for one-off checks. For continuous monitoring or bulk analysis, Google offers an API and there are third-party tools that integrate PSI scores. But for most users, the web interface is enough: enter URL, get insights.
Next, let’s break down how to read the PSI report and understand what all the numbers and suggestions mean.
Understanding Your PageSpeed Insights Report
Once PageSpeed Insights analyzes your page, it will generate a report with several sections. It can look overwhelming at first, but it’s organized into logical parts. Let’s go through each section and explain how to interpret it:
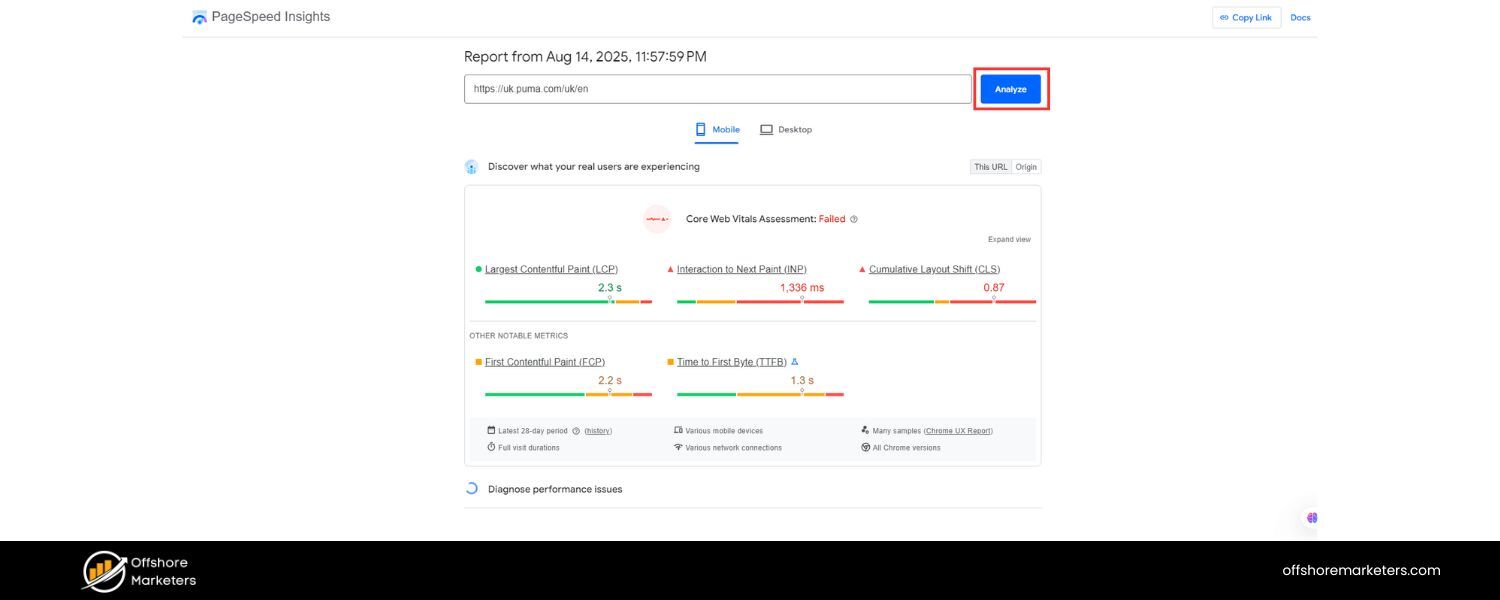
Figure: Example PageSpeed Insights results for a page (mobile test). The Performance score is 37 (Poor), with detailed metrics below. Each metric is labeled green/yellow/red based on its value.
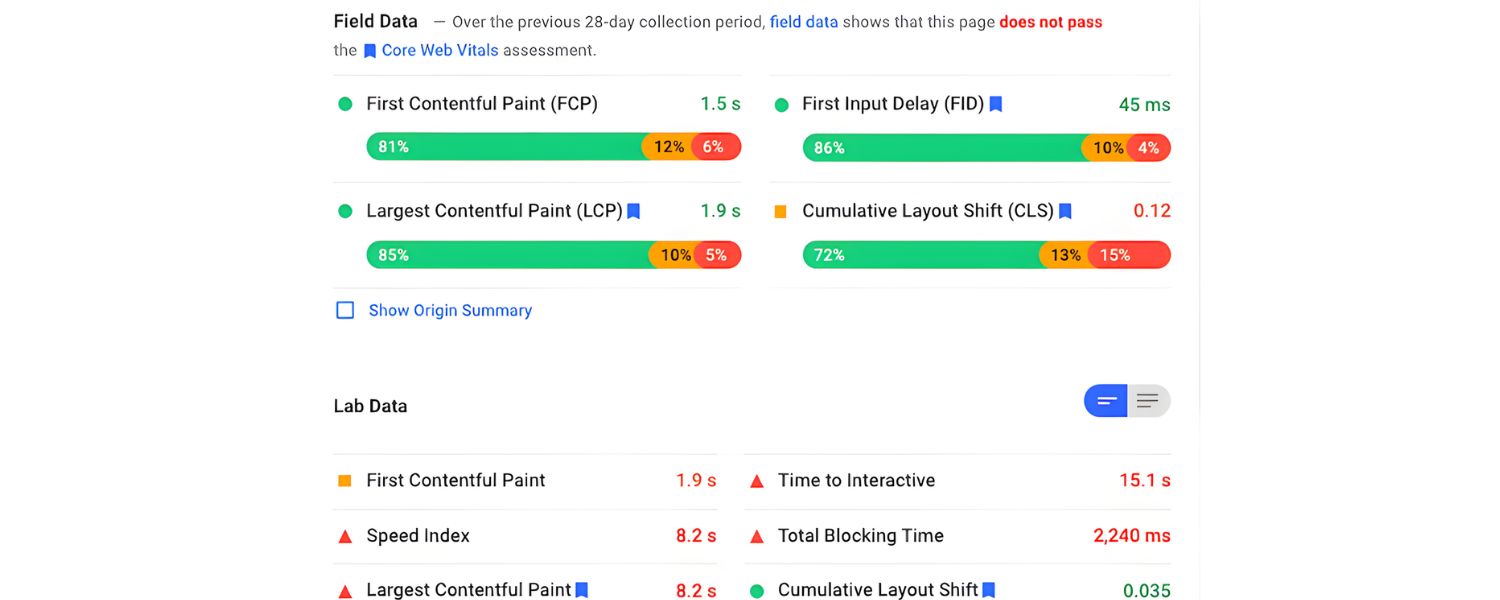
1. Core Web Vitals (Field Data)
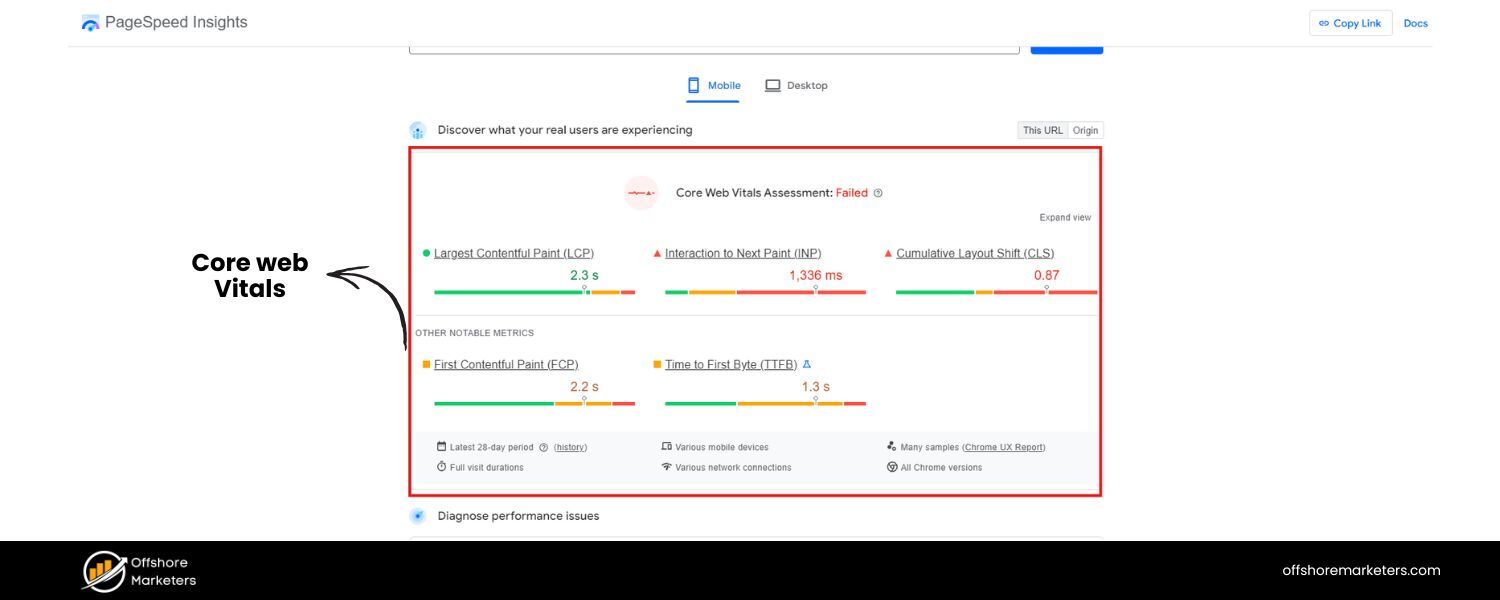
At the top, you’ll typically see the Core Web Vitals assessment based on field data. This section is labeled “Core Web Vitals Assessment” or “Field Data”, and it shows metrics from real users (the Chrome UX Report) for your page or site.
The metrics included here are:
A. First Contentful Paint (FCP): When the first piece of content (text or image) is rendered. A fast FCP means the page is quick to show something to the user. (Good ≤ 1.8s).
B. Largest Contentful Paint (LCP): When the largest element (often a hero image or large text block) is rendered. This represents the main content loading time. (Good ≤ 2.5s).
C. First Input Delay (FID) or Interaction to Next Paint (INP): This measures responsiveness – how quickly the page reacts to the first user interaction (click, tap, etc). FID was the metric until 2024; now INP is used for a broader view of responsiveness. (Good FID ≤ 100ms, INP ≤ 200ms).
D. Cumulative Layout Shift (CLS): Measures visual stability by tracking unexpected layout shifts (content jumping around on load). (Good ≤ 0.1).
E. (Sometimes) Time to First Byte (TTFB): PSI now labels TTFB as an experimental field metric – how long until the first byte of response is received from the server (basically server responsiveness). (Good ≤ 0.8s).
PSI will show the 75th percentile value for each metric (usually next to each, e.g. “LCP: 4.0s”). It also visualizes the distribution of metric values among your users in three color-coded bars (Green = % of “Good” experiences, Orange = “Needs Improvement”, Red = “Poor”).
For example, you might see that 70% of your users had an LCP under 2.5s (good), 20% in the needs-improvement range, and 10% poor (above 4s). These distributions help you understand consistency: ideally, most users should be in the green.
Crucially, PSI will display a “Core Web Vitals: PASSED” message in green if all of LCP, FID/INP, and CLS are in the good range (75th percentile). If any metric falls short, it will say “NEEDS IMPROVEMENT” or “POOR” for that metric and not award a pass.
For SEO purposes, passing Core Web Vitals is a noted ranking factor (albeit a minor one), so that’s a benchmark to aim for. If your PSI report indicates you’re failing any CWV, those metrics should be a top priority to fix.
Note: If your page (or site) is new or low-traffic, PSI may display “Not enough data” for field data. In that case, focus on the lab data and improving metrics until real data becomes available.
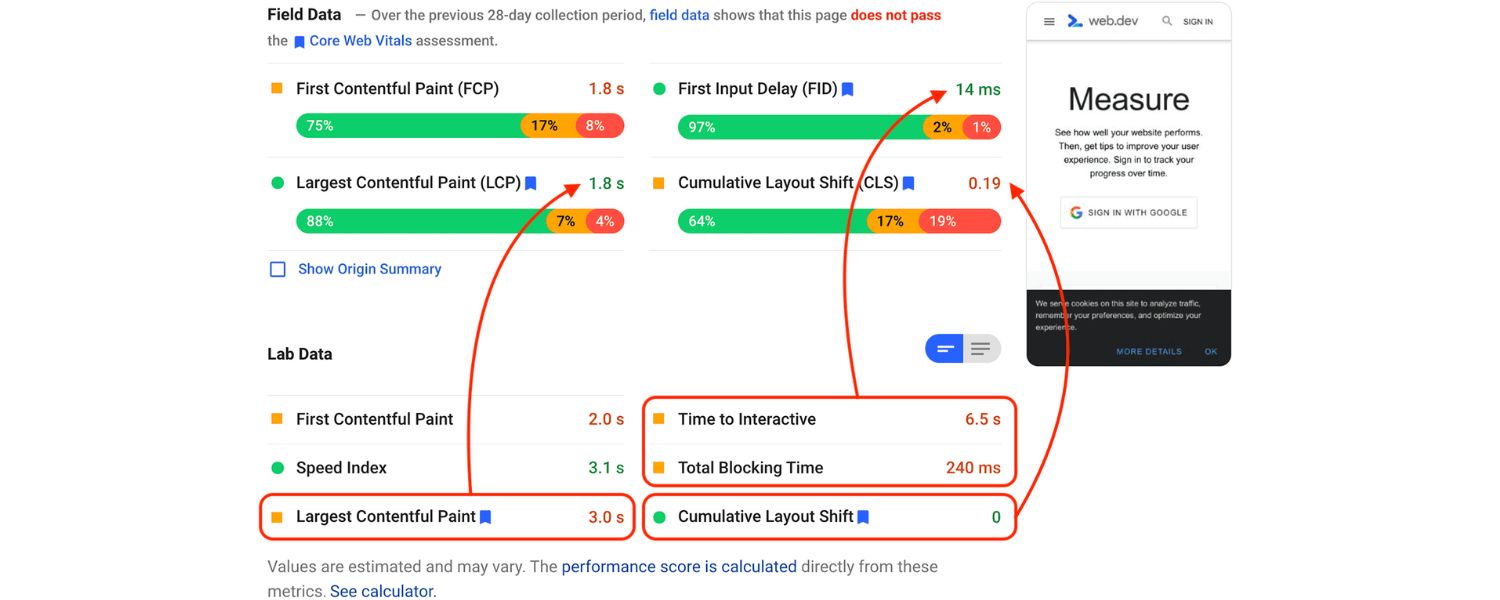
2. Lab Data (Lighthouse Metrics)
Next, the report shows the Lab Data section, often under a heading like “Performance Metrics” or just below the score. This is the result of the Lighthouse test that was run when you clicked “Analyze”. It includes timing metrics measured during page load in the simulated environment.
In PSI’s interface, you’ll see each metric name, its value, and an icon (green check, orange warning, red warning) indicating how that value rates against benchmarks.
The key lab metrics you will see are:
A. First Contentful Paint (FCP): e.g. “FCP: 1.2 s” – time for initial content.
B. Speed Index: e.g. “Speed Index: 3.5 s” – an aggregate score of visual loading speed.
C. Largest Contentful Paint (LCP): e.g. “LCP: 2.8 s” – time for main content to load (should ideally be ≤2.5s).
D. Time to Interactive (TTI): e.g. “TTI: 5.3 s” – when page becomes fully interactive. Long TTI can indicate heavy scripts.
E. Total Blocking Time (TBT): e.g. “TBT: 320 ms” – how much time was blocked by scripts (sum of tasks >50ms). Lower is better (under 150ms is great).
F. Cumulative Layout Shift (CLS): e.g. “CLS: 0.18” – the layout shift score during load. Ideally <0.1.
Each metric might have a colored icon: green if it’s in the good range, etc. Under the hood, these metrics correspond to what we discussed in the scoring formula. If one of these is especially slow (red), it likely dragged down your overall score.
For instance, a high LCP or low TBT can significantly impact the score. The lab metrics are useful for pinpointing what aspect of performance is weakest: Is it the initial paint (FCP) that’s slow (indicating server or render blocking issues)? Or time to interactive (indicating heavy JavaScript)? Or a high CLS (indicating layout jumps due to images or dynamic ads)?
PSI may also show a filmstrip or screenshot of the page loading and a note like “Captured at (time) using Lighthouse X.Y.Z” at the bottom of lab data【38†source】. This just documents the test conditions and when it was run.
Remember: the lab data is from a controlled test (e.g. a Moto G4 on Slow 4G by Lighthouse default). Your real users on newer devices might load faster, or slower on worse networks. Use lab metrics as a baseline for improvement and debugging. Any metric in red or orange is a clear target for optimization.
3. Opportunities & Diagnostics
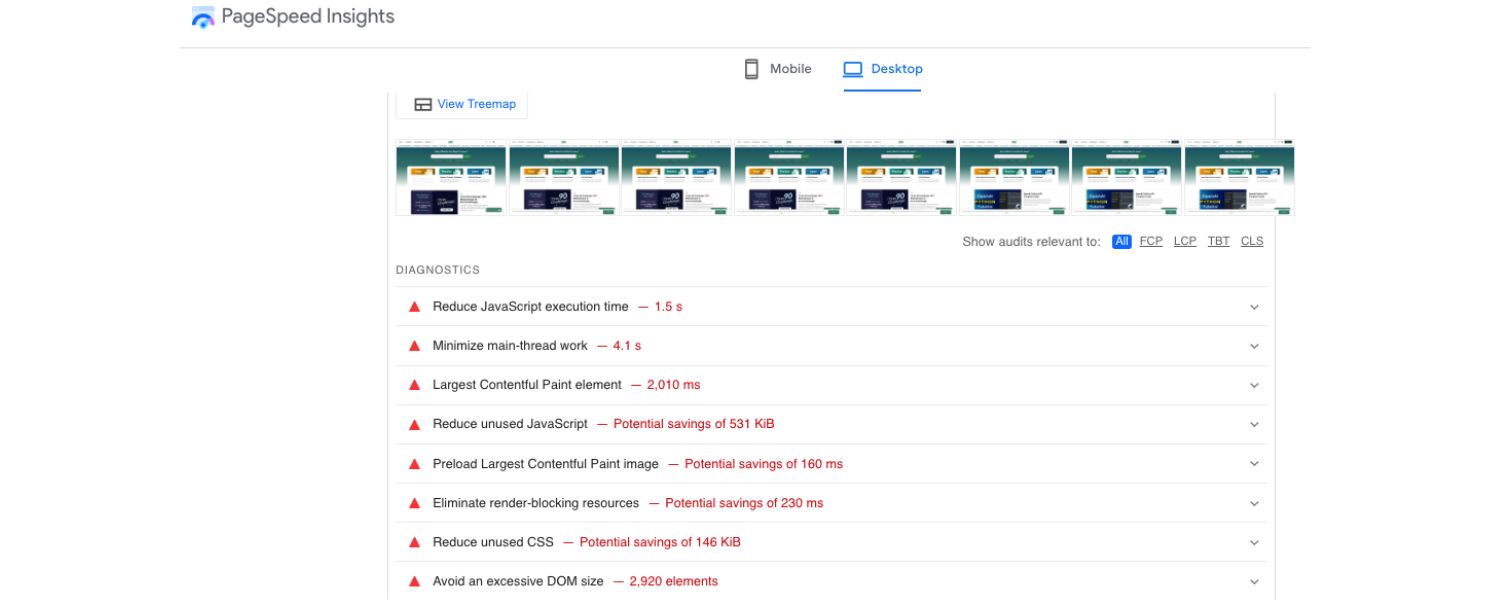
After the metrics, the Google PageSpeed Insights (PSI) report provides an extremely useful section: Opportunities (with potential improvements) and Diagnostics. This is where Google PageSpeed Insights gives specific advice on what to fix to improve page performance.
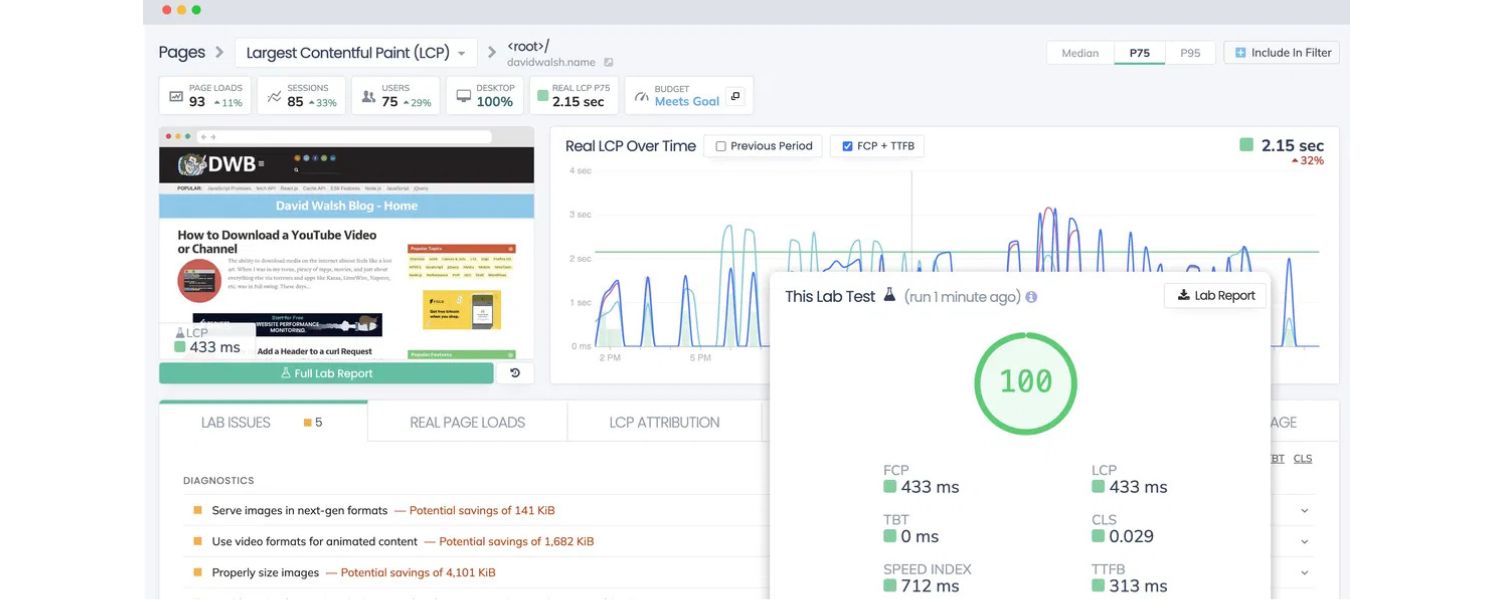
Figure: “Opportunities” section from a PSI report, listing suggestions like reducing unused JavaScript, eliminating render-blocking resources, and properly sizing images, along with estimated savings.
A. Opportunities
This subsection lists suggested optimizations that could improve page load performance. Each item describes an issue and an estimate of how much it’s slowing down your page (referred to as “Estimated Savings”). For example, you might see:
A. Reduce unused JavaScript– Potential savings: 0.3s
B. Eliminate render-blocking resources– Potential savings: 0.24s
C. Properly size images– Potential savings: 0.16s
These suggestions are ordered by impact (roughly). Clicking on each will expand more details, often showing which files or resources are causing the issue. For example, expanding “Eliminate render-blocking resources” might list specific CSS and JS files that are loaded in the page head, blocking the initial render. Similarly, “Properly size images” would highlight images that are larger than the displayed dimensions, wasting bytes.
The Estimated Savings indicate how much faster your page could load if you address that particular issue. While these optimizations don’t directly impact your Google PageSpeed Insights score (the text even notes, “These suggestions can help your page load faster. They don’t directly affect the Performance score.”), improving them will positively affect underlying metrics, which in turn can raise your PSI score on the next test.
Common Opportunities suggestions include: compress images, defer offscreen images (lazy load), eliminate render-blocking CSS/JS, minify CSS/JS, reduce unused code, enable text compression (gzip), leverage browser caching, reduce server response times (TTFB), use next-gen image formats (like WebP), etc.
We will dive deeper into these tips in the next section of this guide. Use the Opportunities list as a practical to-do list, each item addresses a specific performance bottleneck on your page.
B. Diagnostics
This section provides additional information and best practices that aren’t directly tied to speed but affect overall performance or best practices. Diagnostics might include things like:
A. Ensure text remains visible during webfont load
B. Avoid enormous network payloads
C. Minimize main-thread work
D. Reduce the impact of third-party code
E. DOM size warnings
These are often more technical details. For example, “Minimize main-thread work” will tell you how much time was spent on the main thread and break down script evaluation time. “Reduce JavaScript execution time” might flag excessive time spent executing JS (often caused by too many or too large JS files).
“Serve images in next-gen formats” suggests using modern image formats like WebP/AVIF for better compression. While Diagnostics don’t provide a neat time-saving estimate, they offer insight into performance issues that may affect user experience (like oversized images or large DOM sizes).
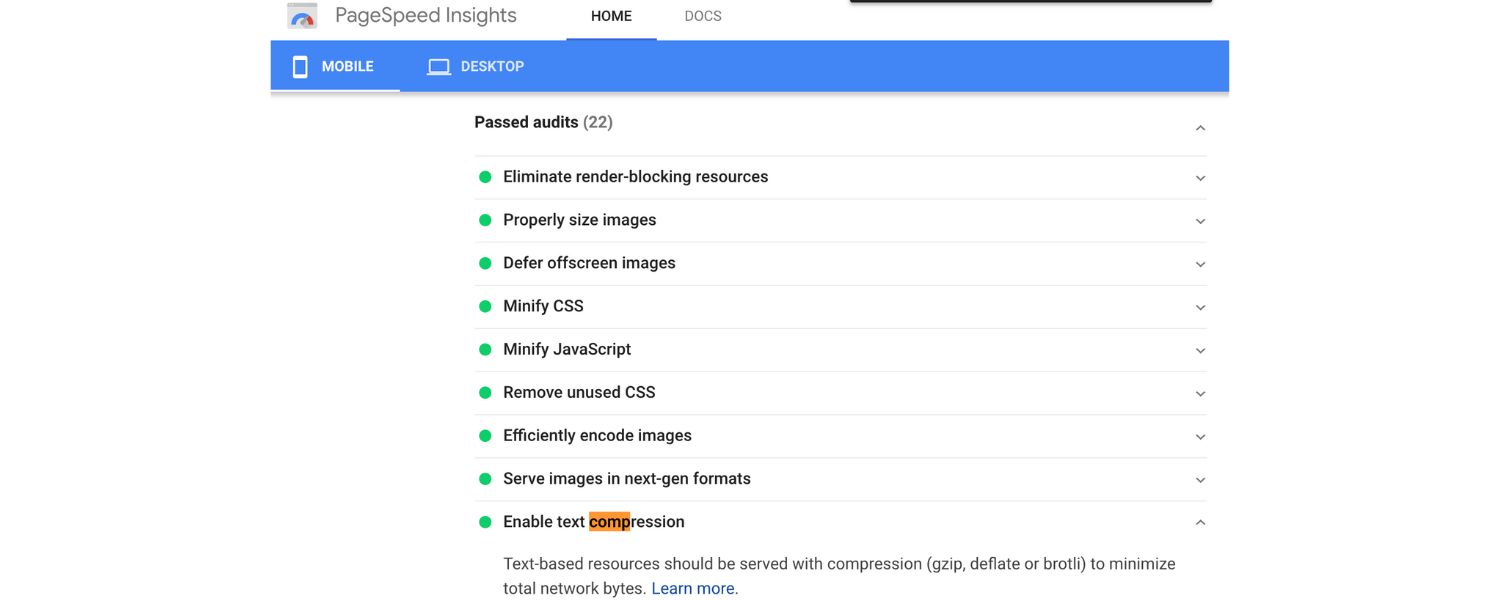
3. Passed Audits
Lastly, PSI may list “Passed Audits,” which highlight areas where your page is performing well. For instance, if you have efficient cache policies or all images are properly encoded, those checks will appear here. It’s essentially a “pat on the back” and can usually be skimmed, as the main value lies in knowing what didn’t need fixing. Focus your efforts on the Opportunities and any flagged Diagnostics.
4. Prioritizing Your Efforts
As you review the Google PageSpeed Insights report, it helps to prioritize. Typically, start with the Opportunities that offer the largest time savings—these often yield the biggest improvement in user experience. Also, take note of which metrics were poor in the lab data.
For example, if Total Blocking Time (TBT) is high due to heavy JS, Opportunities for reducing JS should be a priority. Similarly, if Largest Contentful Paint (LCP) is slow due to large images, focus on image-related suggestions.
Now that we know how to read the Google PageSpeed Insights report, let’s move on to improving those metrics. In the next section, we’ll cover concrete strategies to boost your PageSpeed Insights score and, more importantly, make your website faster for users.
Top 10 Tips to Improve Your PageSpeed Insights Score
Improving your Google PageSpeed Insights (PSI) score is about improving your website performance. Here are 10 proven best practices (with a focus on the common issues highlighted by PageSpeed Insights) to help your pages load faster and more efficiently:
1. Optimize and Compress Images
Images are often the heaviest elements on a page, so optimizing them can yield significant speed gains. Resize images to the maximum dimensions they’ll be displayed at (avoid serving a 2000px image when it’s shown as 500px).Google PageSpeed Insights might flag “Properly size images” or “Efficiently encode images,” indicating you have oversized or uncompressed images.
Compress images using tools or plugins – this reduces file size with minimal quality loss (formats like JPEG/WEBP can often be compressed 50%+). PSI might flag “Properly size images” or “Efficiently encode images,” indicating you have oversized or uncompressed images.
Consider using next-gen formats like WebP or AVIF, which provide much better compression than old JPEG/PNG. For example, converting a PNG to WebP can shrink file size dramatically without visible quality loss. Also, implement lazy-loading for offscreen images (PSI’s “Defer offscreen images” suggestion), this means images below the fold won’t load until the user scrolls, saving initial load time.
Most modern browsers support the loading=“lazy” attribute on images, or you can use a JavaScript library for older support. Optimized images lead to faster FCP/LCP and can easily shave seconds off load time for image-heavy pages.
2. Minify and Combine CSS/JavaScript
Minification removes unnecessary characters (spaces, comments) from code files, making them smaller. Many Google PageSpeed Insights reports recommend “Minify CSS” or “Minify JavaScript” if they detect unminified files. Use build tools or plugins to minify your CSS and JS assets.
Additionally, combine files where possible – serving one single CSS file and one JS file (for your own code) is better than many small files, as it reduces HTTP requests. Fewer requests can lower round trips and overhead (PSI might flag too many requests under “Keep request counts low” diagnostics).
Be cautious: don’t combine files that are needed on different pages unnecessarily (as that could make some pages load code they don’t need). But in general, eliminate duplicate or redundant files, and compress them.
Also enable Gzip/Brotli compression on your server for text files – PSI’s “Enable text compression” audit will check if your server is compressing CSS/JS/HTML responses. Most modern servers do this by default, but it’s worth verifying (tools like GiftOfSpeed can confirm Gzip status).
3. Eliminate Render-Blocking Resources
Render-blocking resources are CSS or JS files that block the browser from displaying content quickly. CSS is render-blocking by default (the browser waits to style content before showing it), and certain JS loaded in the page head can also block rendering.
PSI commonly suggests “Eliminate render-blocking resources”. To address this: inline critical CSS for above-the-fold content, and defer or async load other CSS/JS. You can use techniques like Critical CSS, where you inline the CSS needed for the initial viewport in a
For JavaScript, add the defer attribute to external scripts (or async where appropriate) so they don’t stall the HTML parsing. If using modern JS frameworks, ensure your bundler splits code and loads critical parts early.
Another tip is to load third-party scripts later: for example, put analytics or widget scripts at the end of the body or use async. By removing or deferring these blocking elements, you’ll improve metrics like FCP/LCP (since content can render sooner).
Tools and plugins (like Autoptimize, if you use WordPress) can help automate inlining and deferring resources.
4. Reduce Unused CSS and JavaScript
It’s common for sites to load large frameworks or libraries where only a portion is used. Google PageSpeed Insights (PSI) might report “Remove unused CSS” or “Remove unused JavaScript” along with the kilobytes of unused code.
All that unused code still has to be downloaded and parsed, slowing things down. Audit your styles and scripts: if you included a big CSS framework but only use a few classes, consider trimming it or using a smaller subset. For JavaScript, eliminate libraries or plugins that aren’t crucial.
Splitting your code (code-splitting) so that non-critical JS is loaded after user interaction can also help. There are tools (like webpack’s unused exports detection, PurgeCSS, etc.) that can strip unused code automatically. By delivering leaner files, you reduce network payload (improving load time) and reduce JavaScript execution time (improving TTI/TBT).
In one case, reducing a site’s JS bundle by a few hundred KB by removing unused code improved the PSI mobile score dramatically, because it cut down on main-thread blocking time.
5. Improve Server Response Time (TTFB)
Your server’s speed in returning the initial HTML affects the Time to First Byte (TTFB) and thus FCP. If PSI flags “Reduce initial server response time” or you notice TTFB is high (e.g. > 800ms), you should investigate your backend performance.
Solutions include: using faster hosting, enabling server-side caching (so pages are served from memory or disk cache instead of slow database queries), optimizing database calls, and using a Content Delivery Network (CDN) to serve content from a location closer to the user. A CDN can particularly help global users get faster TTFB.
Also, consider using the latest protocols (HTTP/2 or HTTP/3) which can improve latency. For WordPress or similar CMS, using caching plugins to generate static HTML for pages can vastly speed up TTFB for repeat visits.
Google recommends a server response under ~0.8s for good experience. Every bit of time saved on the server side immediately reflects in user-perceived performance.
6. Leverage Browser Caching
Enabling browser caching ensures that repeat visitors (or those navigating between pages) don’t need to re-download the same resources. If Google PageSpeed Insights (PSI) shows “Serve static assets with an efficient cache policy” (often under Diagnostics), it means some resources (like images, scripts, etc.) don’t have caching headers or have very short cache times, which negatively affects load speed.
To address this, configure your server to send appropriate Cache-Control headers for static files; e.g., images, CSS, and JS can often be cached for days or weeks. Utilize file versioning to bust the cache on updates. This way, a user’s browser will load resources from the local cache on subsequent page visits, drastically speeding up the experience. Additionally, consider caching APIs or data wherever possible to improve performance further.
Most web servers (like Apache and Nginx) allow you to set caching rules by file type. If you’re using a Content Delivery Network (CDN), it can handle caching globally, ensuring users around the world benefit from faster load times. While caching doesn’t improve first-view page speed, it significantly improves return visits and overall site speed perception for regular users. This not only enhances user experience but also reduces network load for your server, making your website faster and more efficient overall.
7. Use a Content Delivery Network (CDN)
A CDN is a network of servers distributed around the world that can deliver your site’s static files (images, CSS, JS, fonts) from a location closer to the user.
The shorter the distance and fewer network hops data has to travel, the faster it loads for the user. If your user is in Asia but your server is in North America, a CDN node in Asia can serve cached content much faster. CDNs also often use optimizations like HTTP/2 multiplexing, optimized TLS, and even image optimizations on the fly.
Integrating a CDN can improve not only TTFB but also throughput for loading resources. Many CDNs exist (Cloudflare, Akamai, Amazon CloudFront, etc.), and some website platforms have built-in CDN support. Using a CDN will usually show up indirectly in PSI as faster timings and perhaps fewer hefty transfer sizes. It’s a backend change that yields frontend speed.
8. Minimize Third-Party Scripts
Third-party scripts (analytics tags, ads, social media widgets, A/B testing scripts, etc.) can significantly slow down a page. They often load additional resources or execute expensive JavaScript.
PSI’s diagnostics might show something like “Third-party usage” or identify scripts from domains like Facebook, Google Ads, etc., with their impact. Every third-party should be scrutinized: Do you really need it? If yes, see if it offers a lightweight version or if you can load it later (after user interaction).
For example, if you have heavy chat widget code, consider loading it after a delay or only on user click (“Click to chat” button). Some third-party scripts allow you to defer or use an async snippet – always do that if possible. Also, remove any third-party tags that are no longer in use (like old tracking pixels).
Reducing third-party clutter will decrease network requests and main-thread work, improving metrics like TBT and TTI. In one case, removing two unused analytics scripts bumped a site’s mobile PSI score from the 60s to 80s because a huge chunk of blocking JS was gone.
Use browser dev tools or PSI’s waterfall (in Lighthouse report) to identify which third-parties are most costly and tackle them.
9. Enable HTTP/2 and Resource Prioritization
This is a more technical tweak, but ensure your site is served over HTTP/2 (or even HTTP/3 if possible). HTTP/2 allows multiple resources to be fetched in parallel over a single connection, which is more efficient than the older HTTP/1.1 that fetched one at a time. Most modern hosts and CDNs support HTTP/2 as long as you’re using HTTPS.
Additionally, you can use techniques like resource hints to prioritize important resources: for example, for critical CSS or hero images, or to external domains (like CDN or API domains) to establish early connections.
PSI might mention “Preload key requests” or “Preconnect to required origins” as opportunities. By preloading your main hero image or critical script, you tell the browser to get those faster, which can improve LCP or TTI.
Likewise, preconnecting to important domains (like your CDN or Google Fonts domain) can shave off latency. Use these carefully, only for a few critical items, but they can give a noticeable boost by loading top priority resources sooner.
10. Keep Your Website Lean and Modular
This is a broad principle: the leaner your site, the faster it will be. This means minimizing heavy frameworks, avoiding giant single-page applications if a simpler approach would do, and generally being mindful of performance as you design your site.
For instance, avoid auto-playing large videos in the background (or use a poster image first, and let the user initiate video). If you have a lot of images, consider techniques like responsive images ( to serve different sizes to different devices) so mobile users don’t download desktop-sized images.
Use font optimization if you have custom web fonts – e.g., font-display: swap to avoid blocking text rendering (PSI will flag if text is invisible during font load). Reduce redirects – each redirect (HTTP 301/302) adds a round trip; PSI will warn “Avoid multiple page redirects” if you have any chain of redirects.
Essentially, every piece of content or code on your page should justify its existence, if it’s not providing significant value to the user, consider removing it for the sake of speed. This might even extend to your page design: simpler pages with well-structured content often load faster and convert better than overly complex ones.
As a marketing expert might say: a fast, focused page often outperforms a slow, bloated page, even if the latter is “fancier.”
By systematically applying these tips, you’ll address most (if not all) of the issues PageSpeed Insights could throw at you. For example, optimizing images and fonts addresses the major visual loading aspects (improving LCP and CLS), while minifying/defering code and removing bloat addresses the interactivity and blocking aspects (improving TTI, TBT, FID/INP).
Remember that you don’t necessarily need a perfect 100 PSI score, in fact, Google’s own advice is that chasing 100/100 isn’t required. Aim for the “green zone” (scores 90+ or at least 80+ on mobile which is harder) and, above all, focus on real user experience. If your site feels fast and responsive to users, and you have no major red flags in PSI (or Core Web Vitals issues), you’re on the right track.
Final Thoughts & Call to Action
In today’s web, speed is no longer a luxury, it’s a necessity. Google PageSpeed Insights is a powerful tool that helps you identify performance weaknesses and provides actionable recommendations to improve speed and user experience.
By leveraging Google PageSpeed Insights and the tips in this guide, you can create a smoother experience for visitors and gain an advantage over slower competitors.
Keep in mind that performance optimization is ongoing. As web technologies, user expectations, and Google’s algorithms evolve, so should your performance strategy. The introduction of Core Web Vitals and metrics like INP shows how performance measurement is advancing through Google PageSpeed Insights.
Make speed checks a regular part of your development workflow. For large sites, consider using the PageSpeed Insights API for automated performance monitoring and catching regressions.
Ultimately, the goal is not just a high PSI score, but to enhance the user experience. A faster site leads to improved engagement, higher conversions, and better SEO, creating a win-win for your business.
Now it’s your turn run a PageSpeed Insights test on your own website. See where you stand, implement a few of the high-impact fixes, and test again.
Each improvement you make is a step toward a faster site and a better experience for every visitor. Your goal isn’t just a higher PSI number, it’s a site that feels instantly fast and satisfying to use.
Call to Action
Ready to boost your website’s performance? Go ahead and test your key pages on PageSpeed Insights. Then apply the recommendations and best practices from this guide. You’ll be amazed at the difference a few optimizations can make.
Don’t let a slow website be the reason you lose visitors or rankings, take action today to speed up your site, and enjoy the benefits of happier users and improved SEO! If you want more content like this, visit our Blogs for more tips and insights.

Shopify SEO: Guide to Ranking Your Store and Driving Sales
Most Shopify store owners set up their store, list their...

Content Marketing : Definitive Guide to Strategy, Content Types, and Measurable ROI
Content marketing generates 3x more leads than outbound marketing at...
Above the Fold: Guide to Conversions, Rankings and Faster Pages
Above the Fold in 2026: The Complete Guide to Conversions,...

Off-Page SEO Checklist: Guide to Building Real Authority
Most websites spend months creating great content, only to wonder...
What Is Keyword Bidding? The Complete Strategy Guide for Smarter Ad Spend
Most advertisers believe the highest bid wins the auction. It...
.png)
.png)
.png)
.png)
.png)

2026 ALL RIGHTS RESERVED MADE IN INDIA
.png)